meep
July 22, 2021, 9:20pm
42
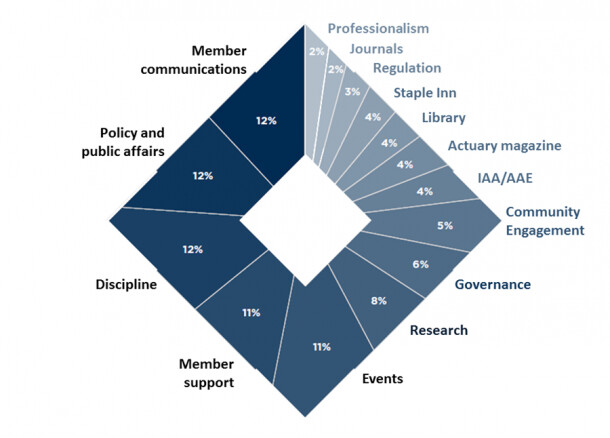
Upcoming webinar on data visualization:https://www.soa.org/prof-dev/webcasts/2021-data-visualizations-elements/
based on this competition:
We have people with examples using Power BI, Tableau, JSON, and Excel (I’m the one who used Excel)
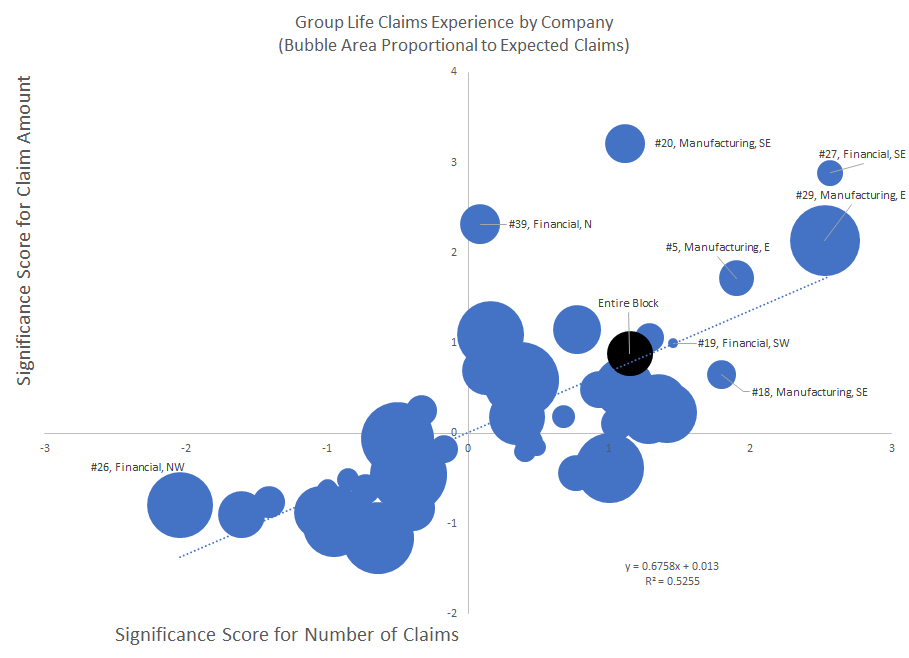
One of the presenters will be covering key aspects of our entries (this had been a contest), and provide a critique in how we could improve the visualizations.
1 Like
meep
August 6, 2021, 9:31pm
45
Just bumping – webcast will be next week.
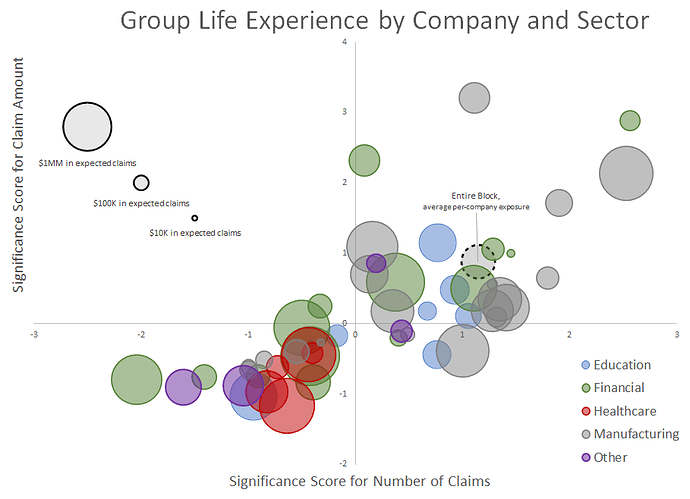
One of the things I did was take my original graph:
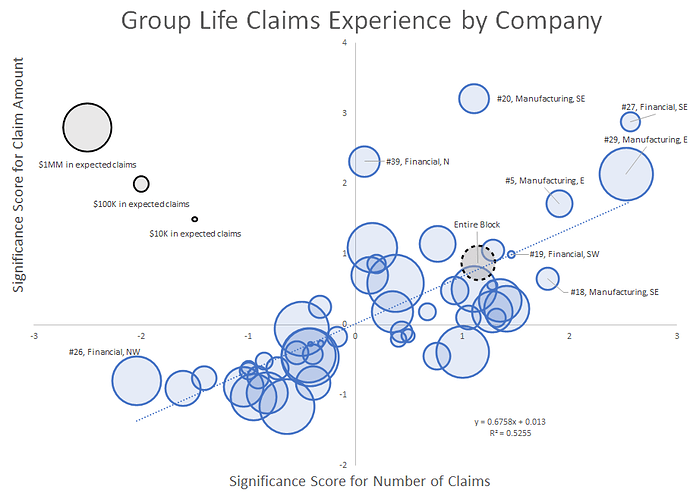
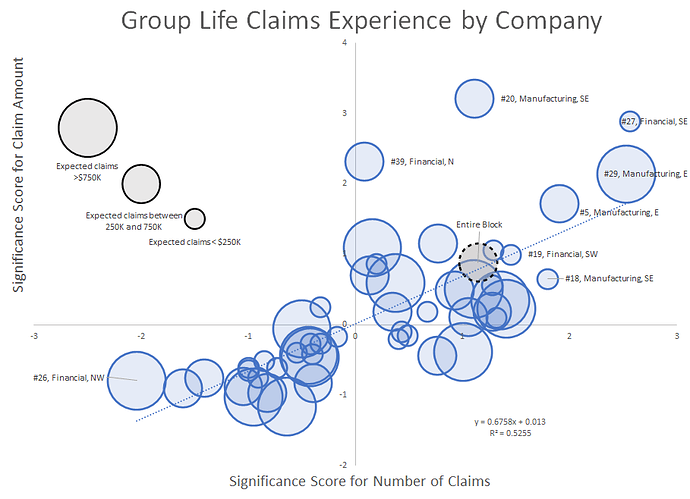
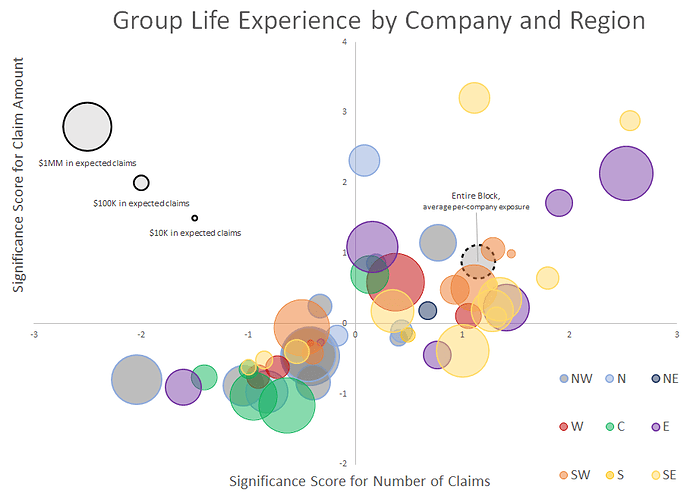
and then I got feedback from the main judge, and I re-did this one 4 ways:
the graphs without explanation
Generally, I dislike doing bubble graphs, but I have had fun making adjustments, etc.
meep
August 6, 2021, 9:38pm
46
After the webcast, I may edit together the video I submitted for the competition, with my own commentary later.
meep
August 25, 2021, 1:50pm
47
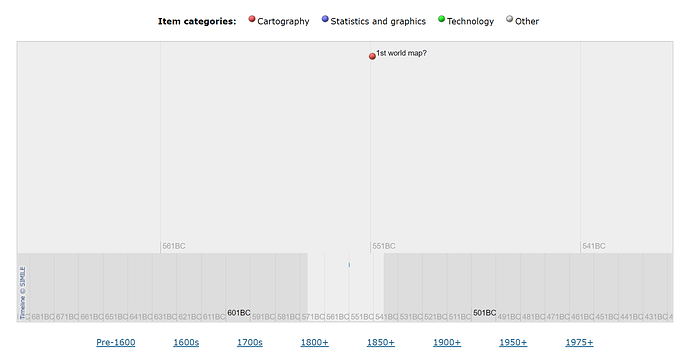
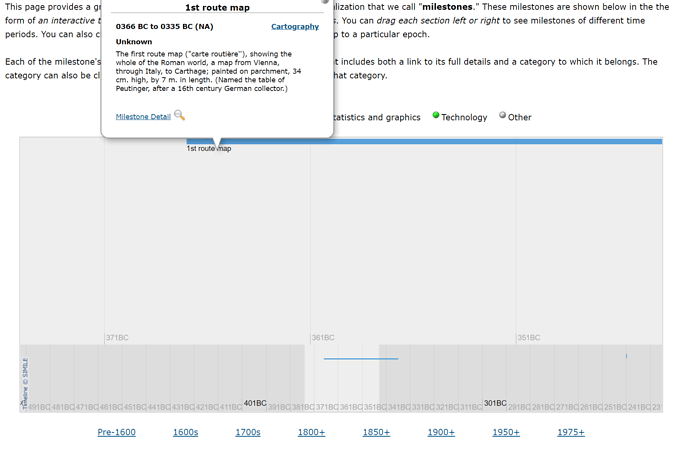
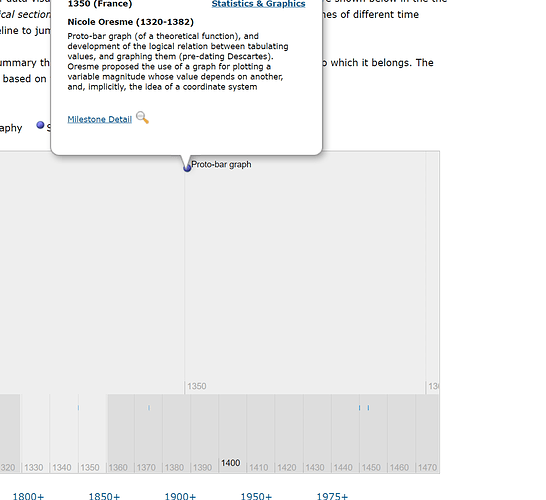
etc.
Neat stuff, even if the visualization of the timeline is a bit ugly.
meep
October 6, 2021, 11:30am
48
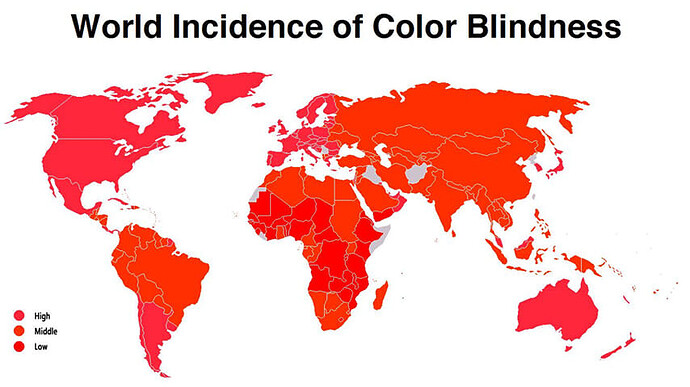
Yoinked from Terrible Maps:
meep
October 8, 2021, 12:36pm
50
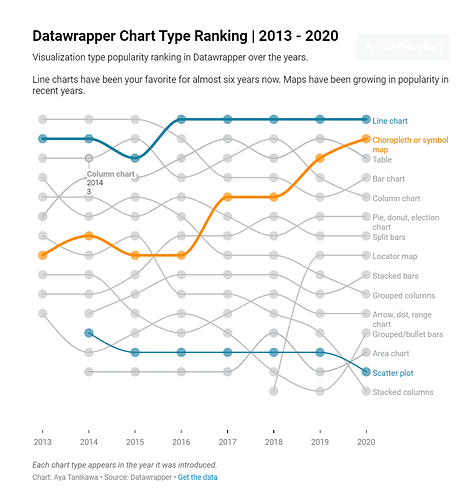
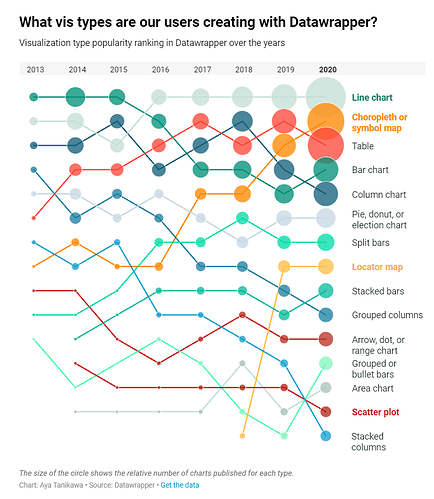
From Datawrapper (tool used to make/embed graphs in websites)
Users’ most popular graph type:
That just tracks the ranking.
Here is a bubble chart, which has bubble size to show how many graphs are being made.
meep
October 9, 2021, 12:43pm
52
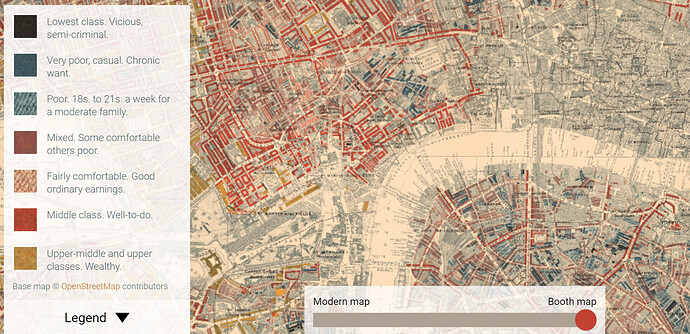
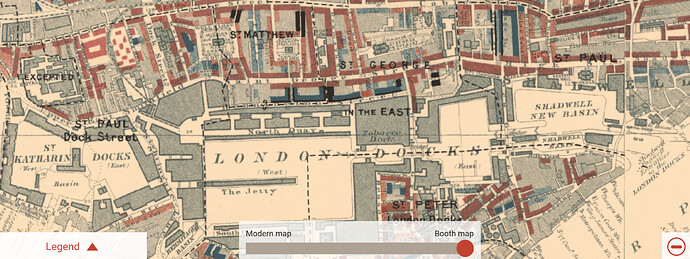
To get that nasty taste out of my mouth, Charles Booth’s poverty maps of London
From 1886 to 1903, while Charles Booth was conducting his landmark survey on the life and labour of London's poorest inhabitants he created poverty maps to illustrate the conditions of the lives of these people. Booth's maps were based on observations of differences in lifestyle and focused on qualitative factors: food, clothing, shelter, and relative deprivation. Booth and his team of researchers visited every street in London to assess each household's class. The household's class was d For the...
meep
October 14, 2021, 12:25pm
53
meep
December 11, 2021, 3:30pm
55
Free O’Reilly text by Claus O. Wilke
1 Like
meep
December 14, 2021, 3:42pm
56
RIP Leland Wilkinson, the author of the Grammar of Graphics, which inspired ggplot in R
Leland Wilkinson (November 5, 1944 – December 10, 2021) was an American statistician and computer scientist at H2O.ai and Adjunct Professor of Computer Science at University of Illinois at Chicago. Wilkinson developed the SYSTAT statistical package in the early 1980s, sold it to SPSS in 1995, and worked at SPSS for 10 years recruiting and managing the visualization team. He left SPSS in 2008 and became Executive VP of SYSTAT Software Inc. in Chicago. He then served as the VP of Data Visualizati...
1 Like
meep
December 16, 2021, 6:11pm
59
1 Like
Marcie
December 16, 2021, 6:14pm
60
This is clearly incomplete as I don’t see any 3-D pie charts.
