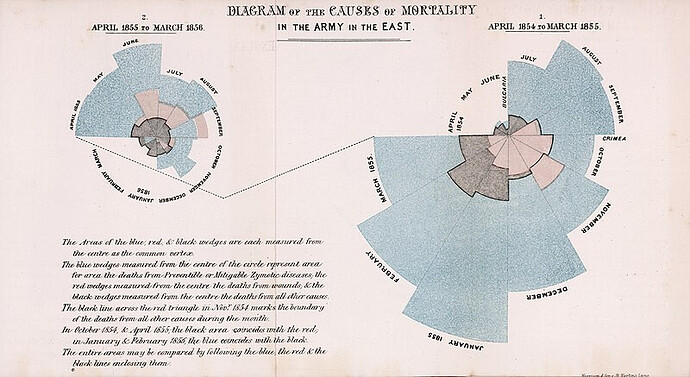
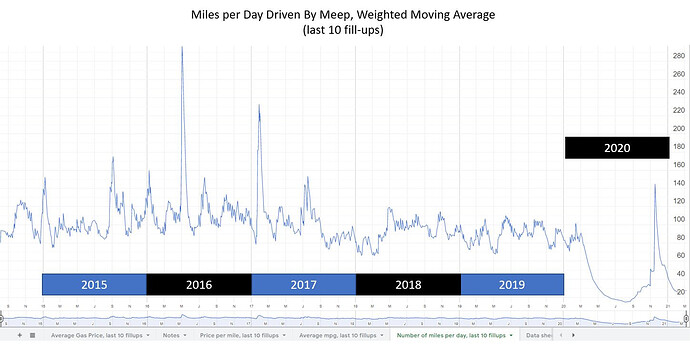
Oops! That’s no fun.
Okay, I have a new motto:
“Whenever I am infuriated, I revenge myself with a new diagram.”
I swear, I’ll embroider this
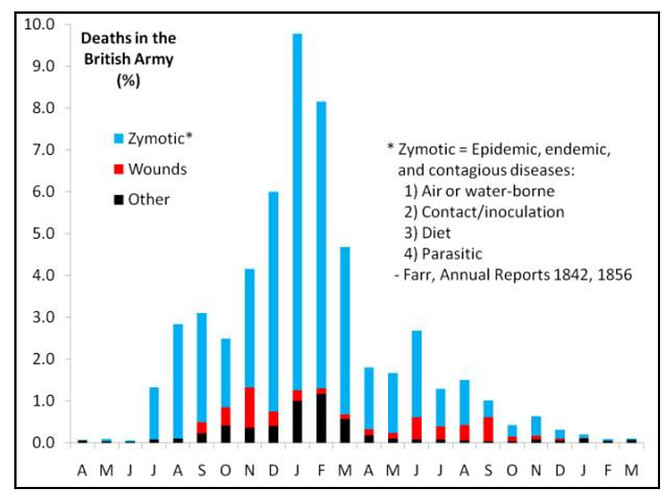
Okay, I found a stacked column version of that diagram, and I think some of the issues are overblown.
Here’s the graph:
Okay, the Sanitary Commission arrived in March 1855. Yes, there had been a big drop in deaths from January to March 1855, but that was no guarantee of the large drop from March to April. To be sure, the deaths due to disease/malnutrition may have decreased in a similar pattern even without the Sanitary Commission, but I am a bit skeptical.
Thanks for posting that. I listened to that podcast, then wondered what the bar stack would look like. This seems far easier to interpret than the rose.
Also, note the (tiny) jump in the following November from October. Might be some seasonal issues that cannot be fixed, but that were exacerbated by shitty (literally) conditions.
However, what is “Deaths in the British Army (%)”?? Percentage of what?? Total armymen? Certainly not of total deaths.
Well, not the total army in the Crimea, either. 10% of them dead in one month? then 8%? Sure, new soldiers would have been shipped all the time, but no.
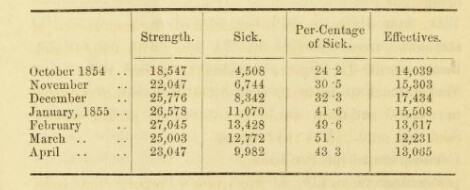
Okay, here we go… I found the book (and it is a large book):
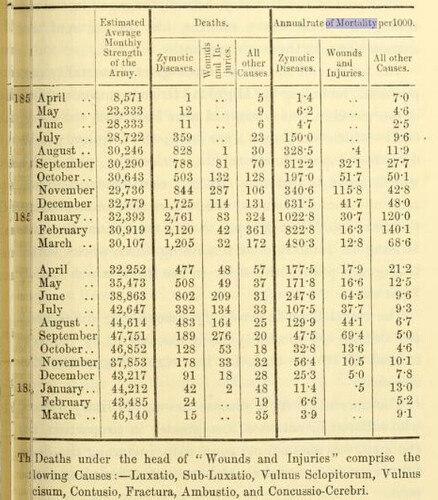
A table showing very high levels of illness among the troops:
found this:
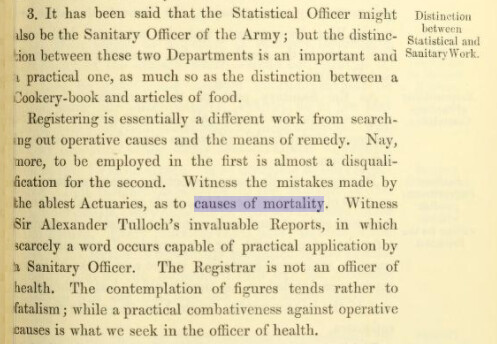
I’m trying to see if I can get the table of figures behind the graph so I can redo it myself…
Anyway, this is going to become a blog post. Thanks, @knoath and @dr_t_non-fan !
You’re welcome!
Two interesting things:
- “Witness the mistakes made by the ablest actuaries, as to causes of mortality.” I did not know that actuaries determined causes of mortality. Maybe that should say “mortuaries”?
- January’s Zymotic Diseases deaths per 1000 is over 1000. At that rate, all soldiers would be dead within the year.
The way she annualized the 1-month mortality experience was simply multiply it by 12 (I just checked).
8.5% mortality * 12 = 102% mortality
Of course, the proper way to annualize the 1-month mortality is to do the survival function:
1-year survival = (1 - .085)^12 = 34%
The annualized mortality should be 66%. Ta da.
“Witness the ablest nurses, trying to do actuarial work…”
That last 2% might be hard to explain
Thanks for the idea, y’all!
From Wikipedia -
Indeed, Nightingale is described as “a true pioneer in the graphical representation of statistics”, and is credited with developing a form of the pie chart now known as the polar area diagram or occasionally the Nightingale rose diagram , equivalent to a modern circular histogram, to illustrate seasonal sources of patient mortality in the military field hospital she managed.
I have decreed: this will be the repository of informative/useful/good dataviz info
I am about to create a thread on AWFUL dataviz
Kickstarter –
https://www.kickstarter.com/projects/visionary-press/visionaries
Yes, the books are pricey.
Yes, I’m backing for the 3-book “reward”.
A twitter thread on accessibility in dataviz
Using horrible stair design
There was a dataviz contest the SOA ran.
Here are the results:
[we’re supposed to be doing a webcast about this later]
