meep
52
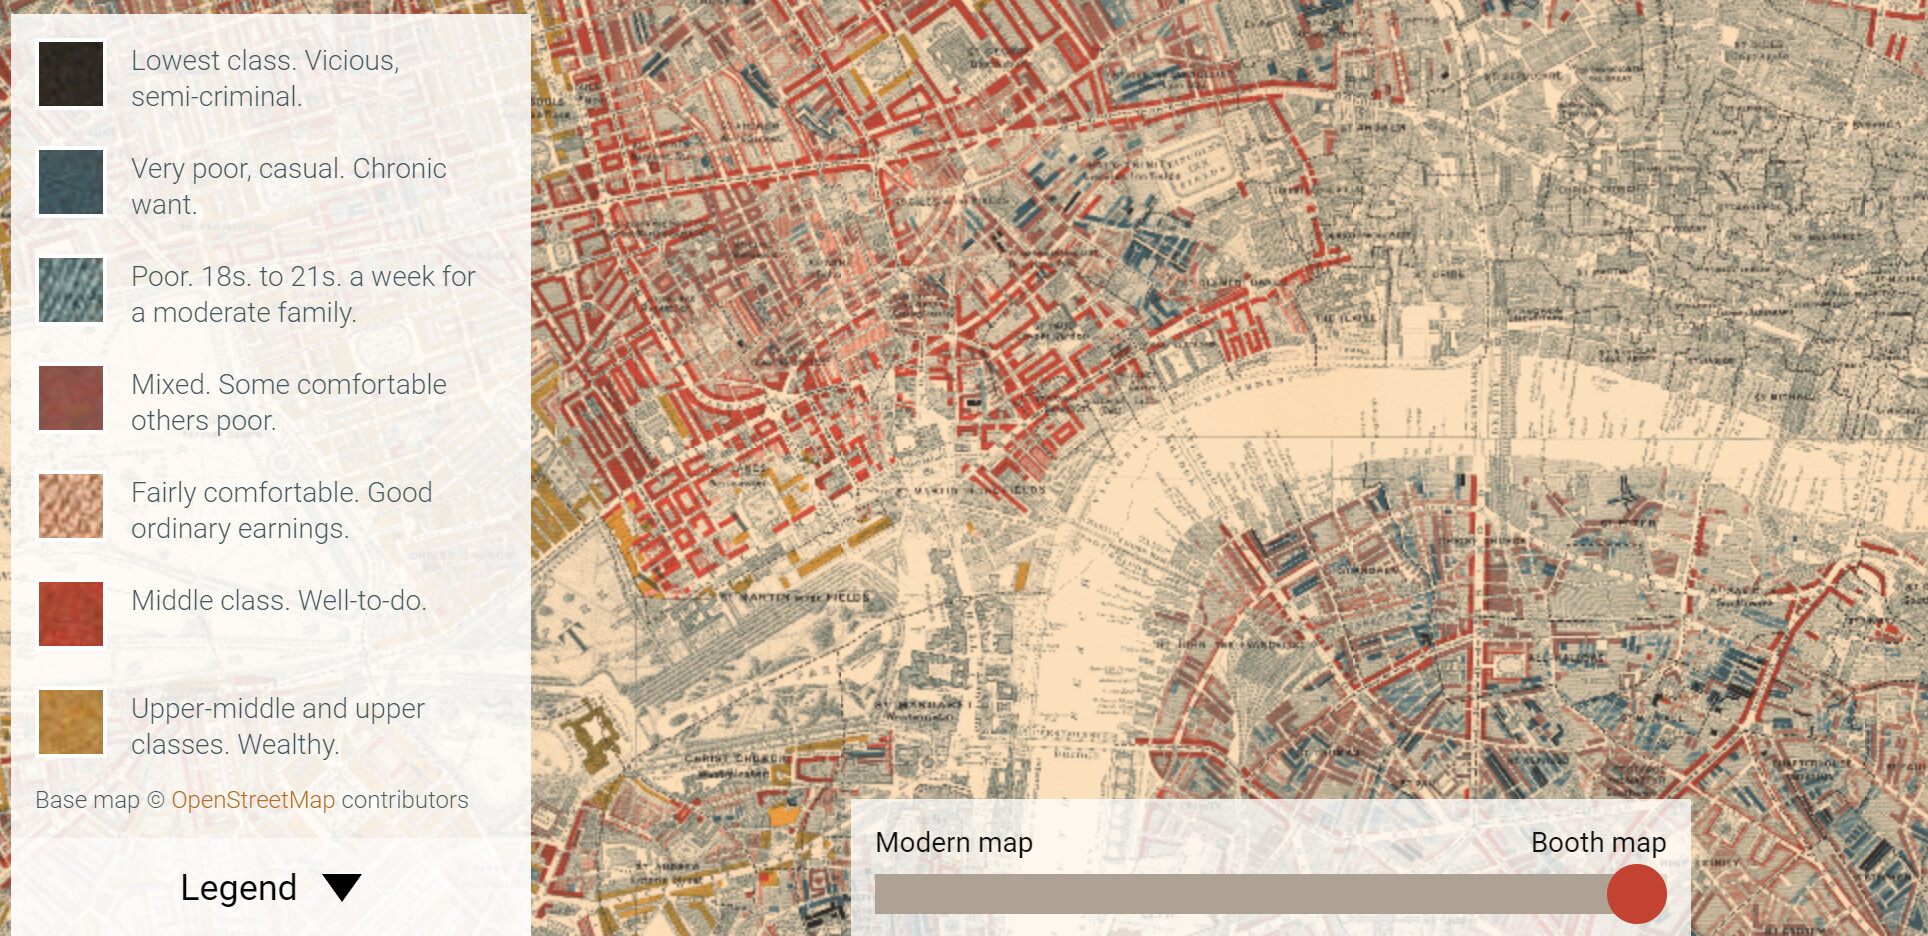
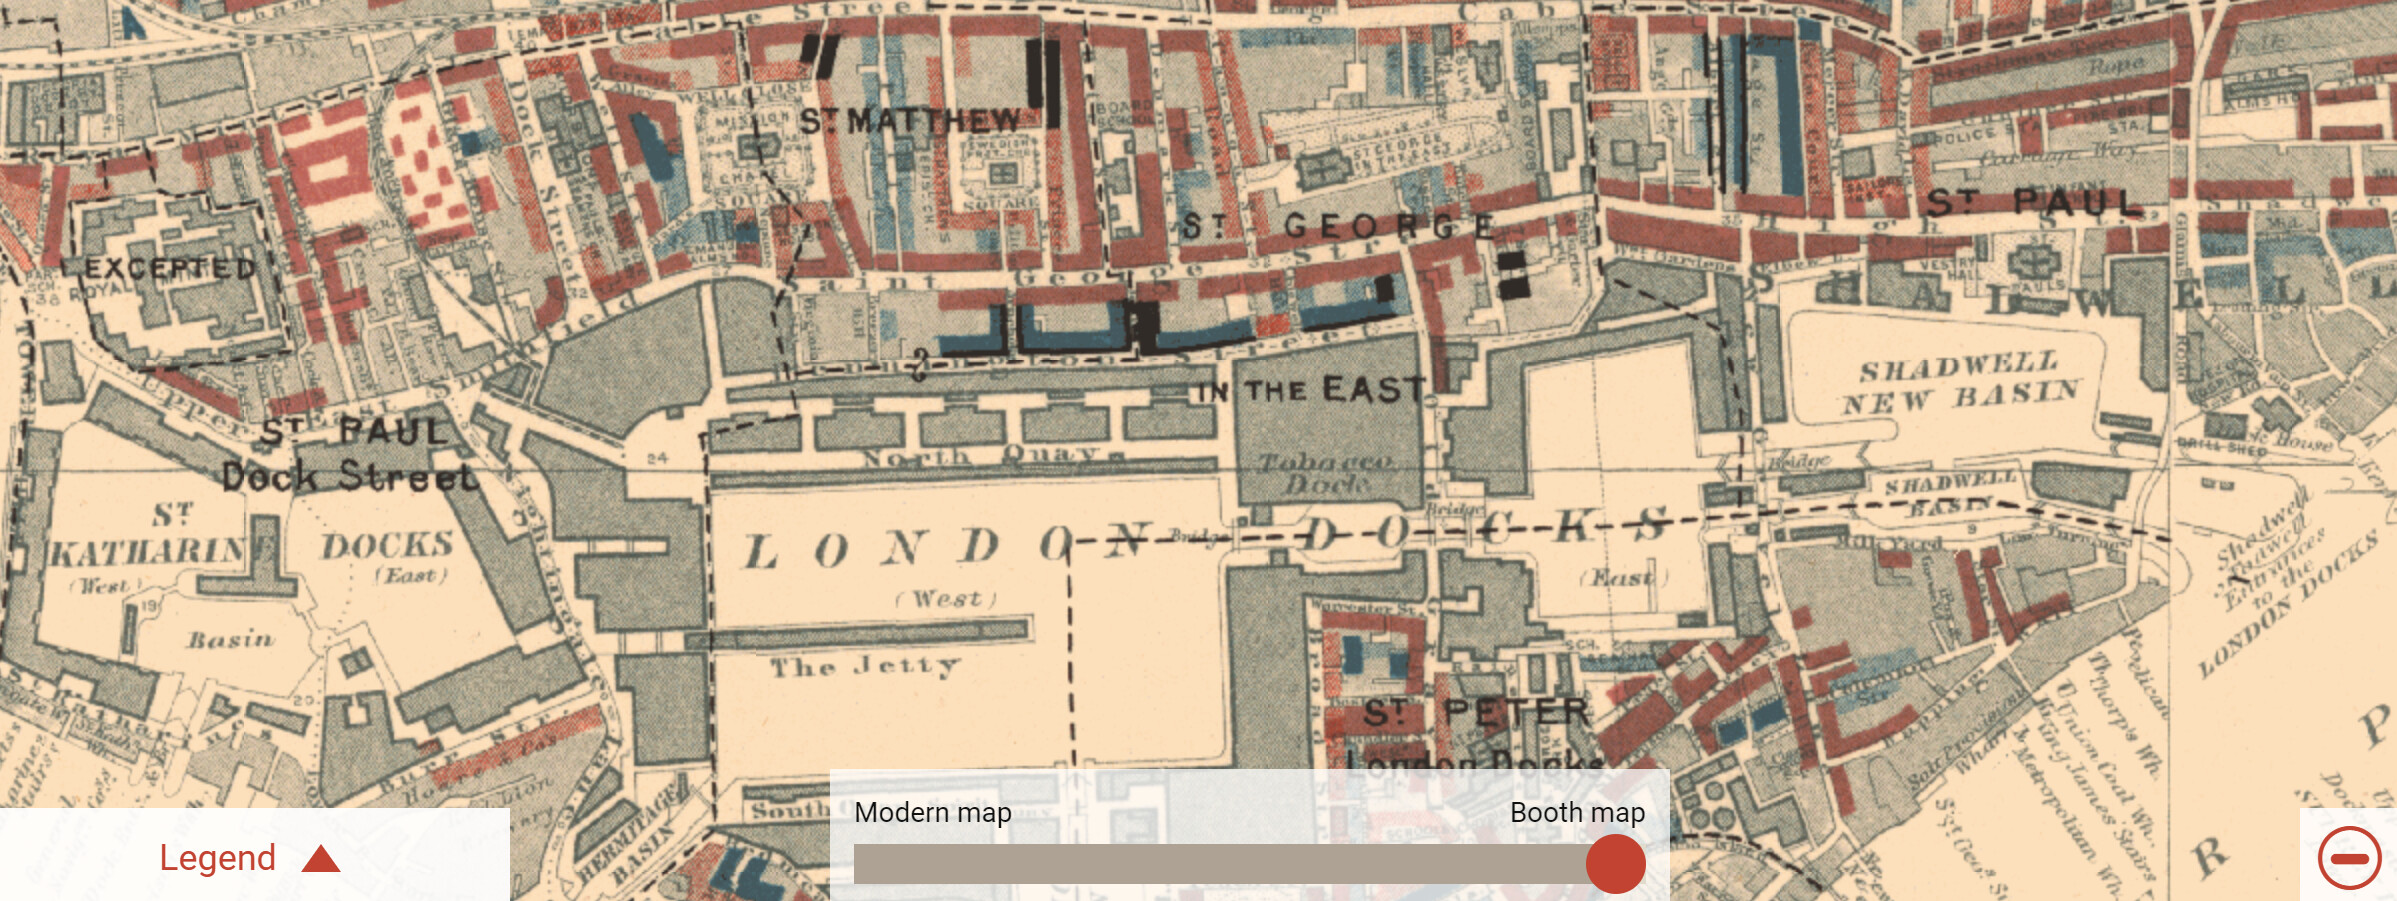
To get that nasty taste out of my mouth, Charles Booth’s poverty maps of London
https://booth.lse.ac.uk/learn-more/what-were-the-poverty-maps
https://booth.lse.ac.uk/map/13/-0.1291/51.5071/100/0
meep
53
meep
55
Free O’Reilly text by Claus O. Wilke
1 Like
meep
56
RIP Leland Wilkinson, the author of the Grammar of Graphics, which inspired ggplot in R
https://link.springer.com/book/10.1007/0-387-28695-0
1 Like
meep
59
1 Like
Marcie
60
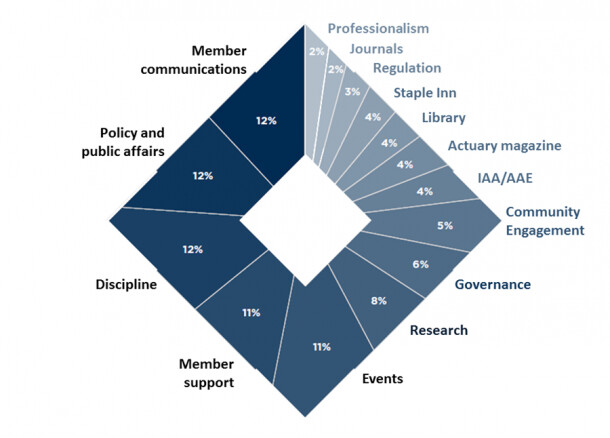
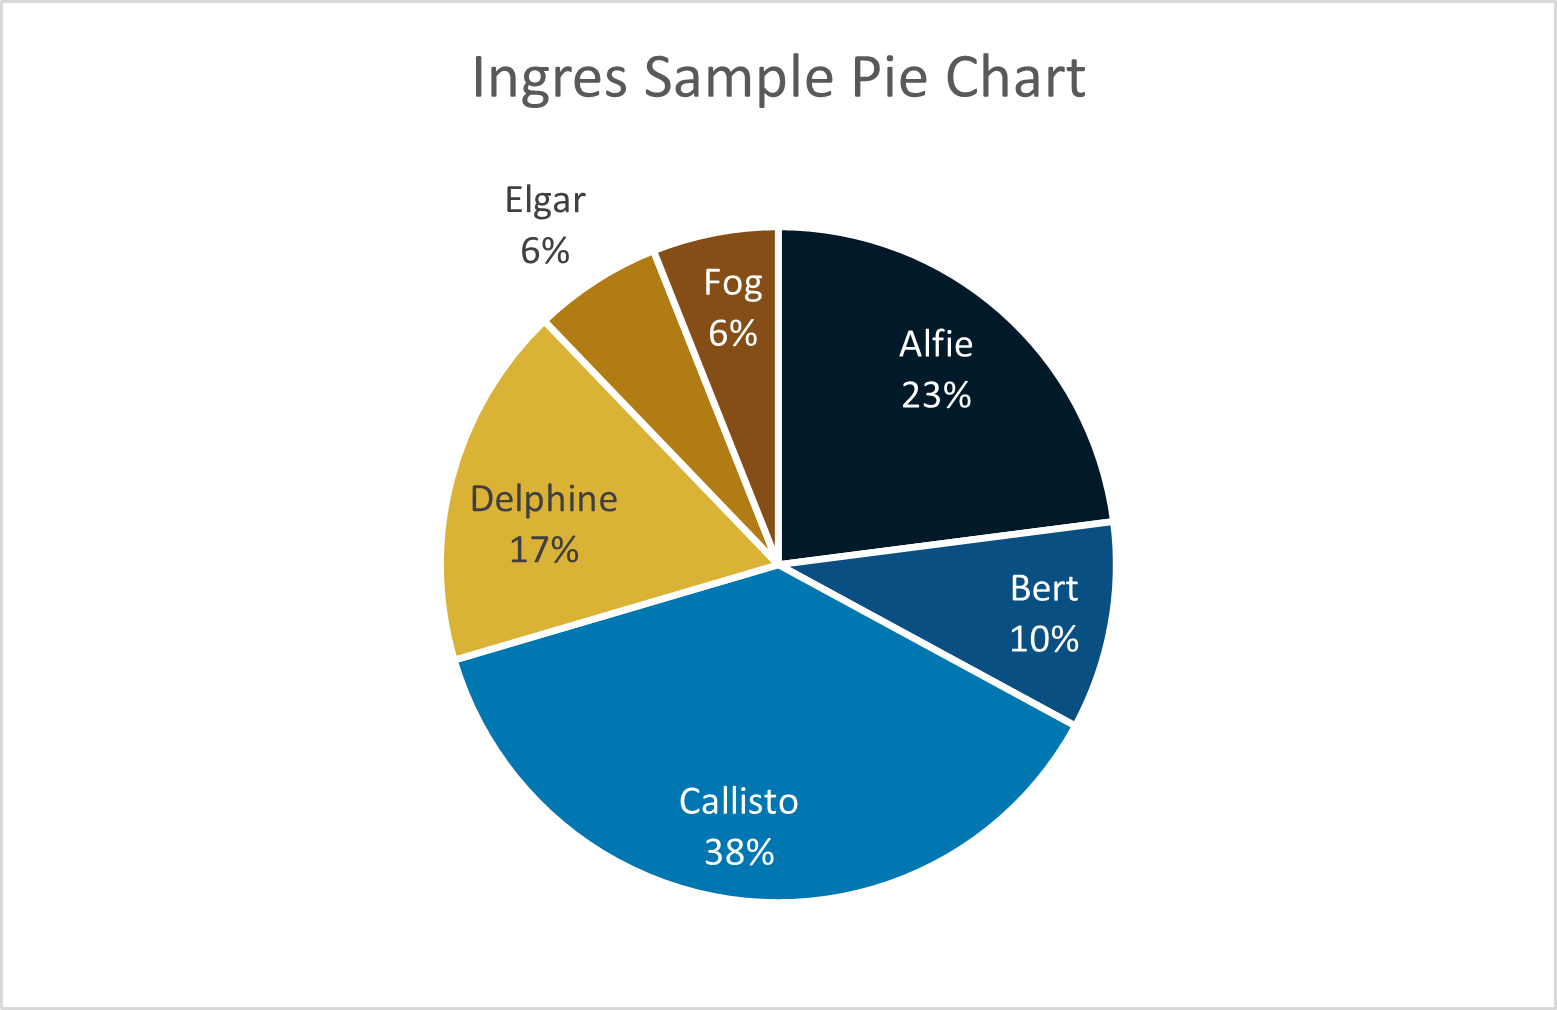
This is clearly incomplete as I don’t see any 3-D pie charts.
meep
62
I have a gift for those who use Excel:
link to get the compressed folder:
and the blog post with some other stuff in it
see, it can even make pie charts look nice.
meep
63
I talked w. Harsh Jaitak about some stuff, but spent most of the time talking about dataviz
Marcie
65
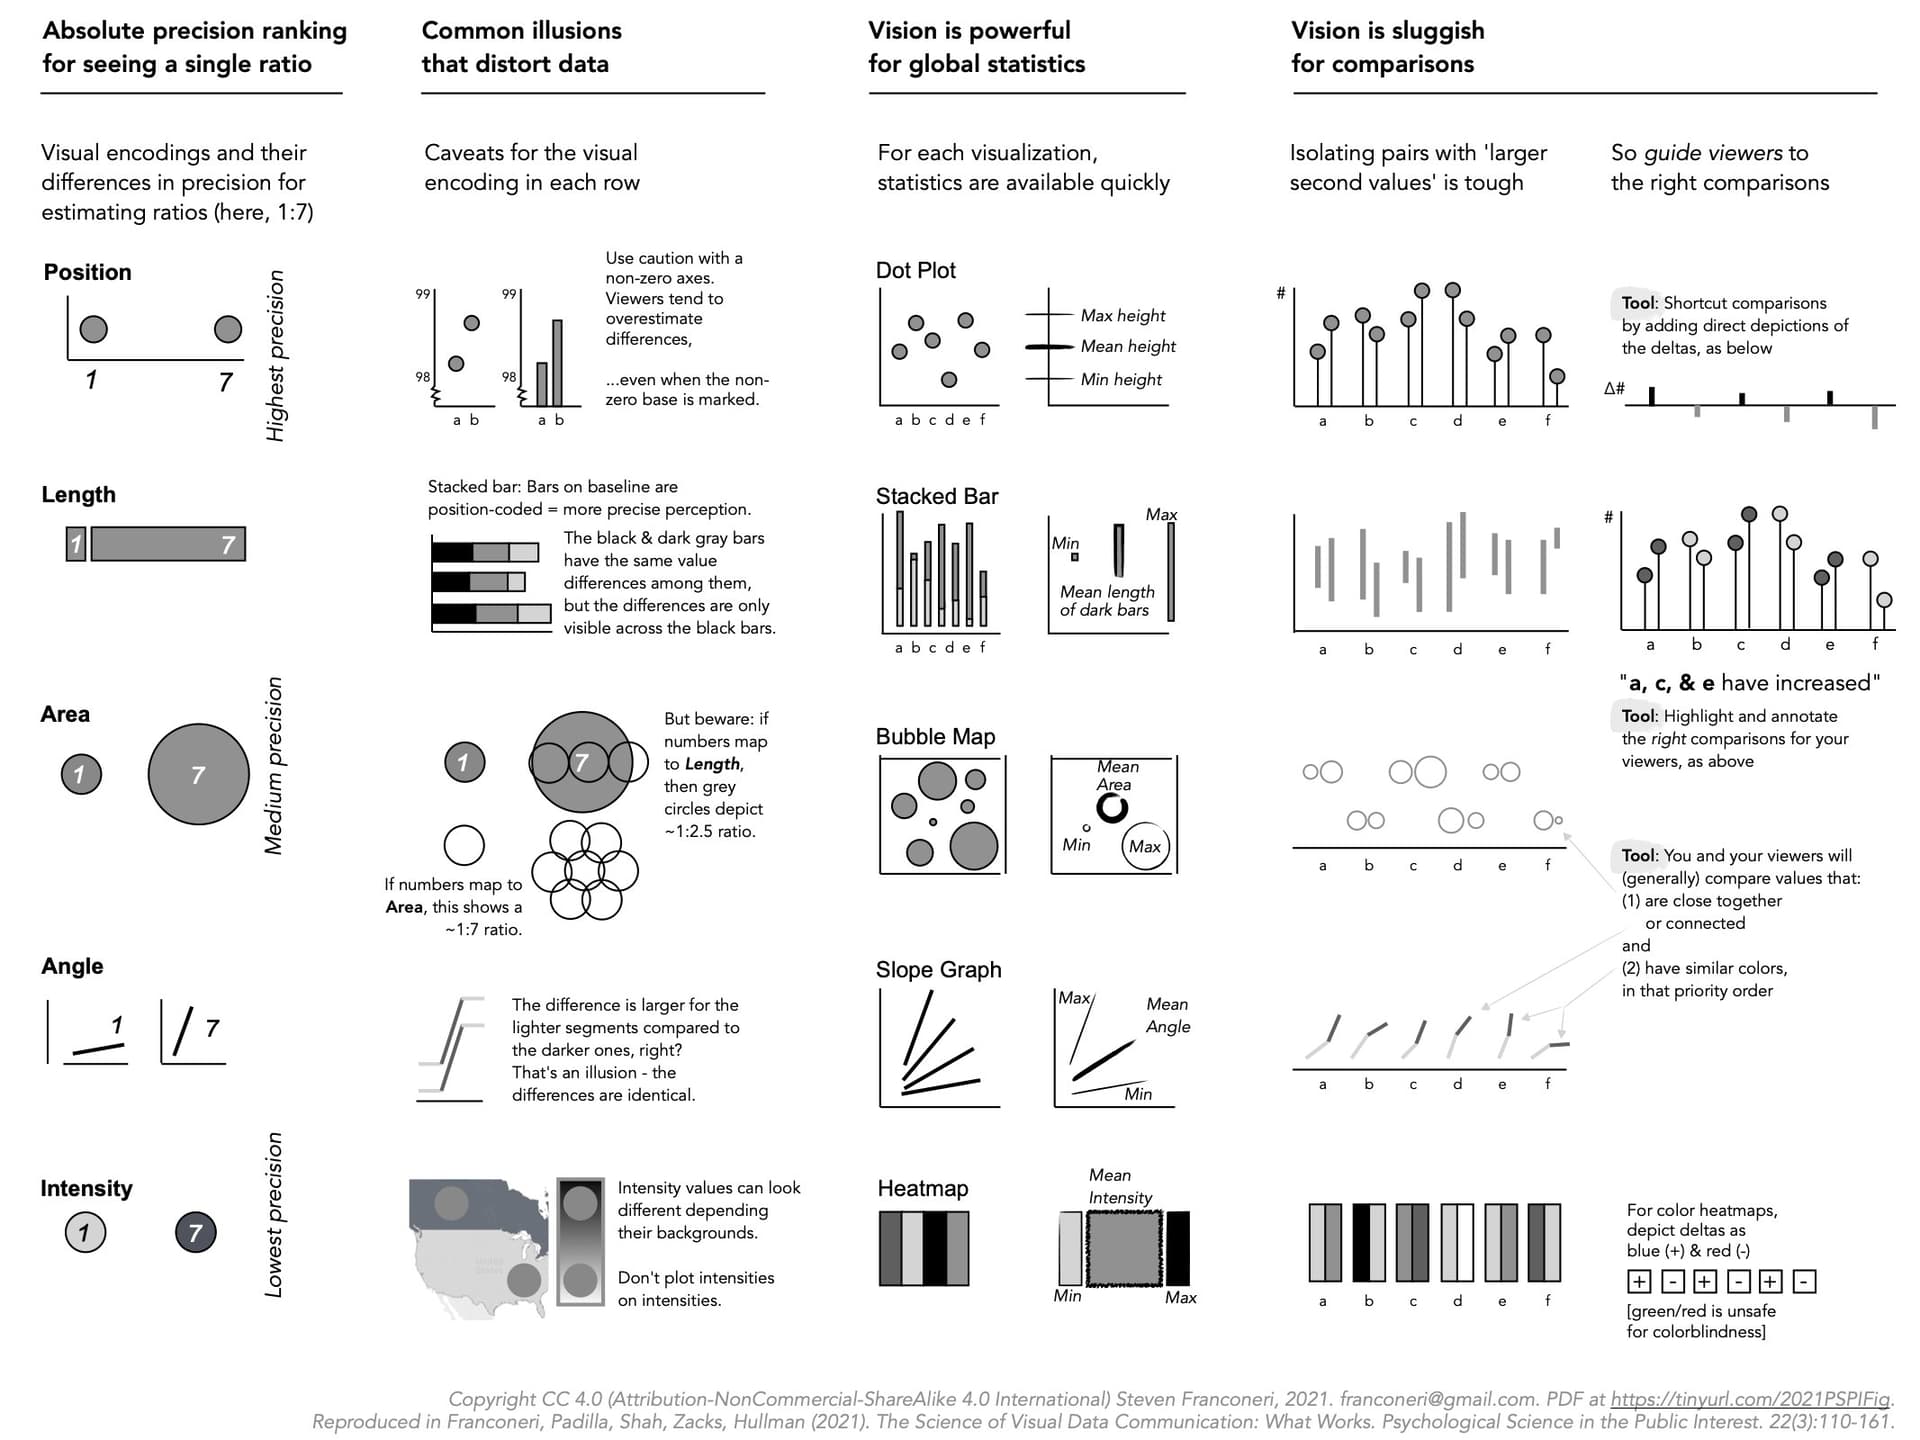
Way too much text for a data viz.
1 Like
meep
66
I need to harvest these later…
meep
67
Maybe I should start a separate thread, but for right now, I’ll put this here.
I’m putting together a few videos with some tips/how-tos
1 Like
meep
69
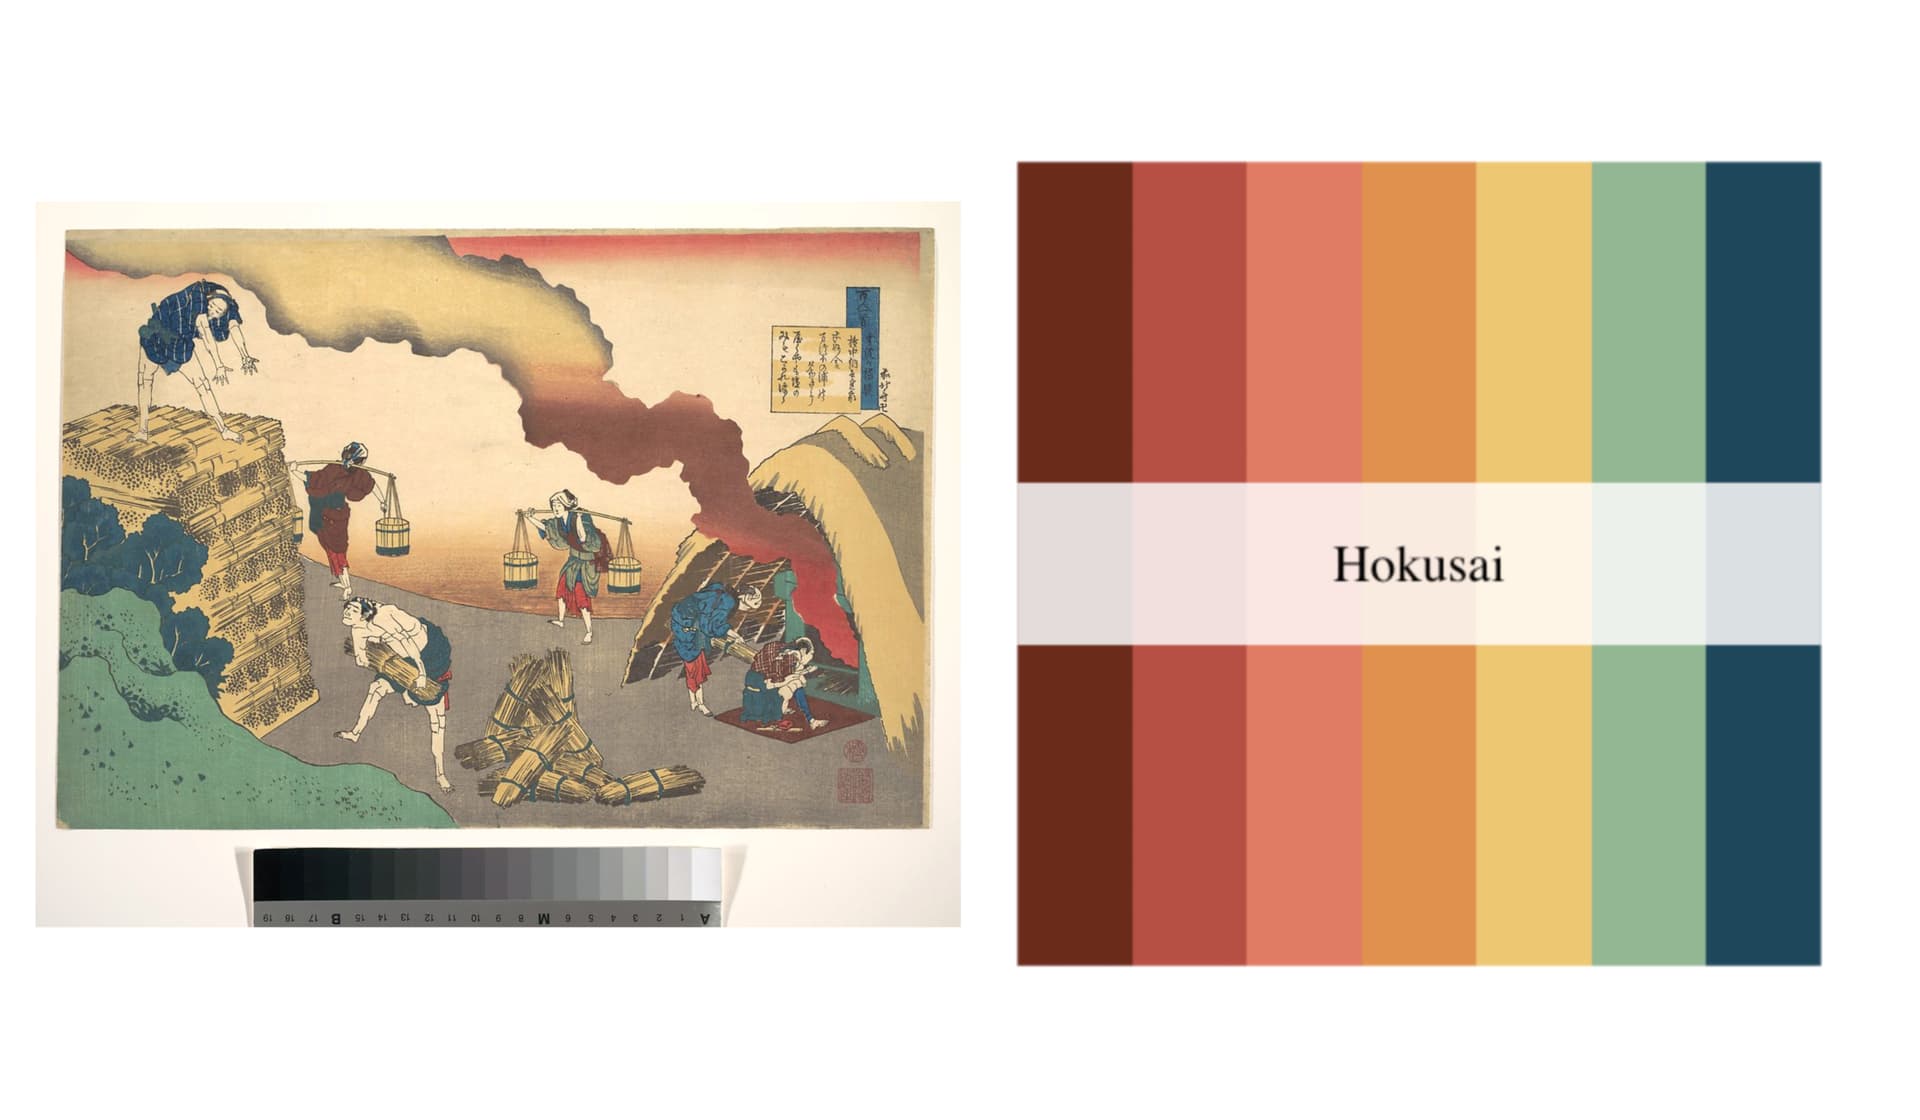
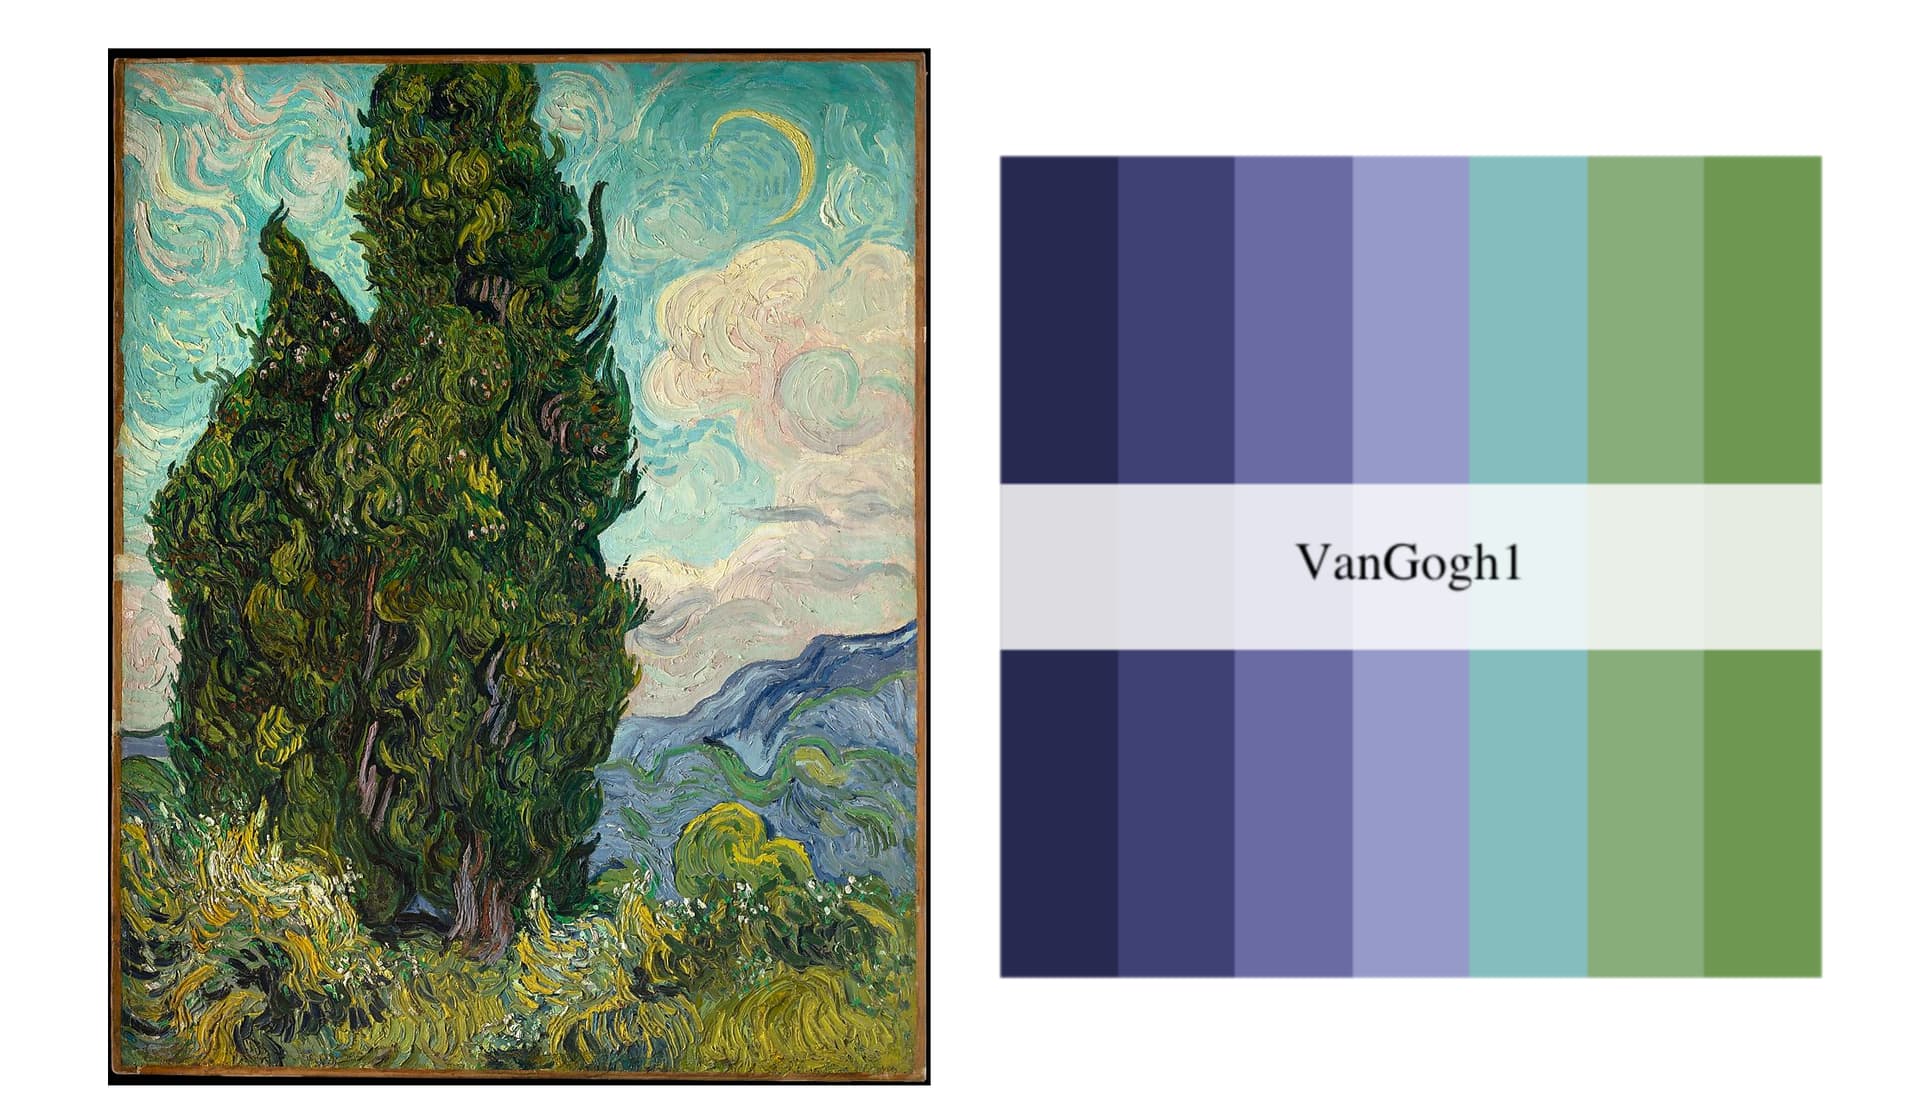
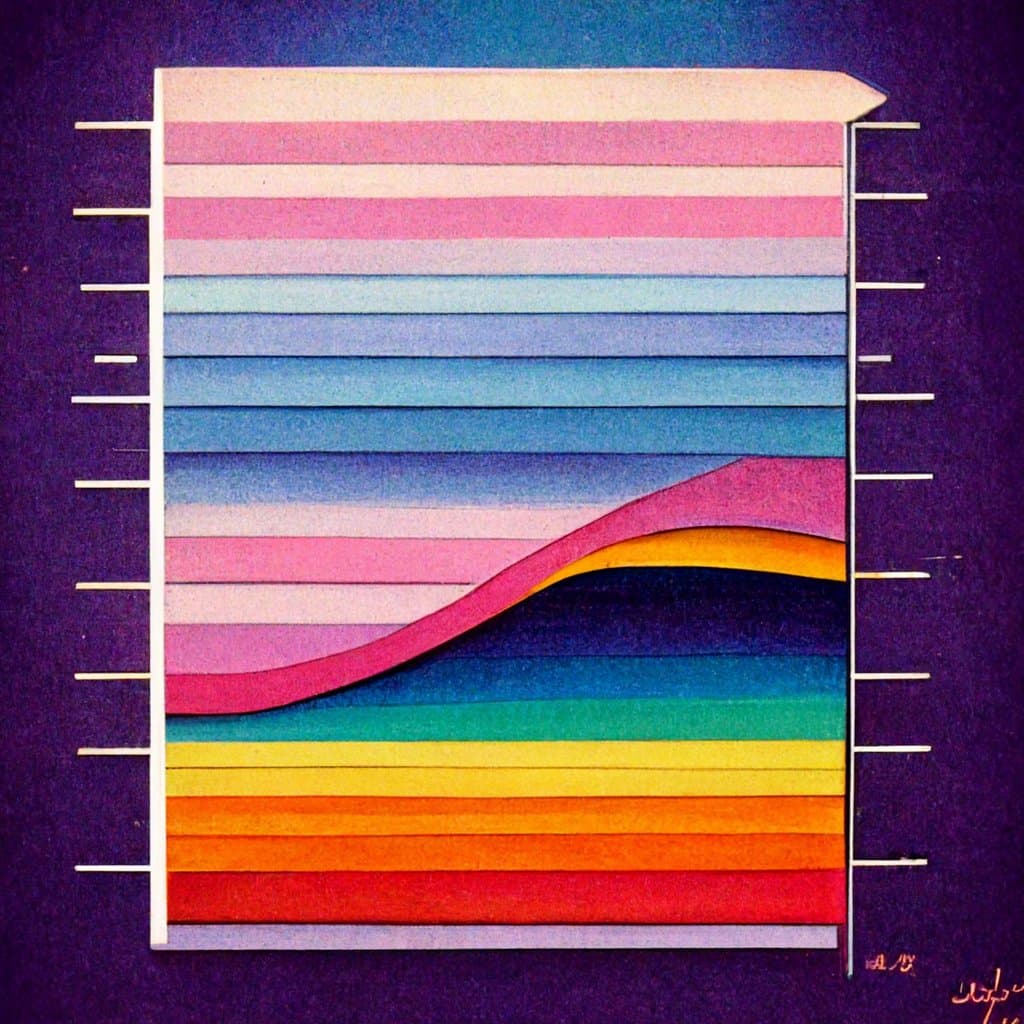
Someone using an AI called Midjourney to create dataviz in the style of various artists and designers
I like the Lisa Frank one