https://www.wsj.com/articles/u-s-10-year-treasury-yield-hits-1-11609912588
I’m really looking forward to a time of increasing interest rates. Eventually.
https://www.wsj.com/articles/u-s-10-year-treasury-yield-hits-1-11609912588
I’m really looking forward to a time of increasing interest rates. Eventually.
I liked this animation of the yield curve [with the sound off]
Cheap Dollars Attract Foreign Investors to Treasurys
Pension funds have also become big buyers of Treasury bonds
The dollar depreciation is linked to the high levels of liquidity in the market from a combination of Federal Reserve stimulus and colossal fiscal spending from the White House, analysts said.
…
U.S. money-market yields have come under pressure from the excess liquidity, with some pushed toward zero.
…
To be sure, many analysts are expecting Treasury yields to tick up as U.S. economic growth and inflation pick up. The median of 47 estimates projects that the benchmark 10-year government bond yield will reach 1.90% by the end of the year, according to data from FactSet.
It’s been a while (I suppose we’ve got more than one thread, too… but oh well)
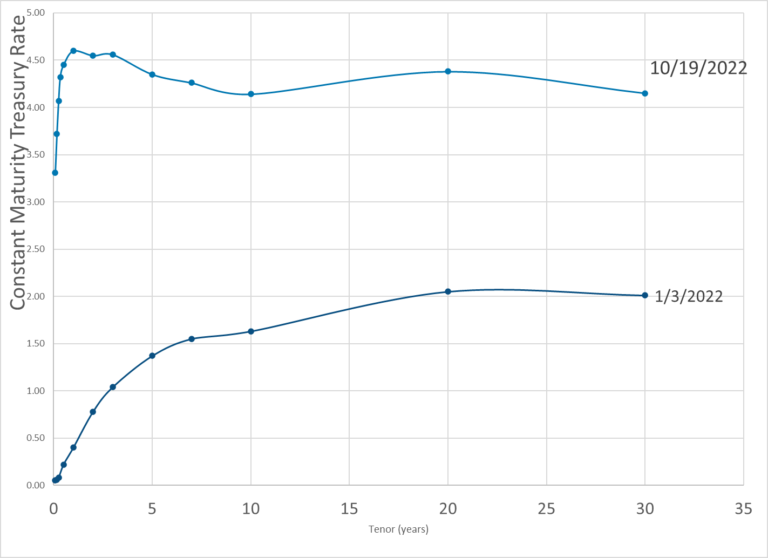
Here are yesterday’s rates (compared to the beginning of the year)
look at that lovely inversion
The inversion has become a lasting fixture for 2022. Most carriers base their preliminary year-end financials on 9/30 numbers. The difference between now and 12/31 should be very interesting, and make it very difficult for actuaries developing 12/31/2023 memos to guess where 2023 will lead.
4-month T-bill was added to the curve today.
Yes, I saw that when I updated my graph this morning.
They added the column before there was a number to put in there.
So, I’ve sometimes been updating a yield curve first thing in the morning on actuarial.news

Just added the 4-month in:
prior day for comparison:
4-month seems superfluous.
This is the year-end Treasury yield curve. How does the inversion affect cashflow testing?
| Date | 1 Mo | 2 Mo | 3 Mo | 4 Mo | 6 Mo | 1 Yr | 2 Yr | 3 Yr | 5 Yr | 7 Yr | 10 Yr | 20 Yr | 30 Yr |
|---|---|---|---|---|---|---|---|---|---|---|---|---|---|
| 12/30/2022 | 4.12 | 4.41 | 4.42 | 4.69 | 4.76 | 4.73 | 4.41 | 4.22 | 3.99 | 3.96 | 3.88 | 4.14 | 3.97 |
09/30/2022 | 2.79 | 3.20 | 3.33 | N/A | 3.92 | 4.05 | 4.22 | 4.25 | 4.06 | 3.97 | 3.83 | 4.08 | 3.79
Most work was probably done as of 9/30. Here’s the 9/30 curve. Seems less inverted than 12/31/22.
We’ve had a full year (12 months) of inverted yield curve. When’s the recession?
you tell me
and yes, there’s a weird dip yesterday at the 4-month
Quite the move on the 30-year lately:
Sucks to be in TLT