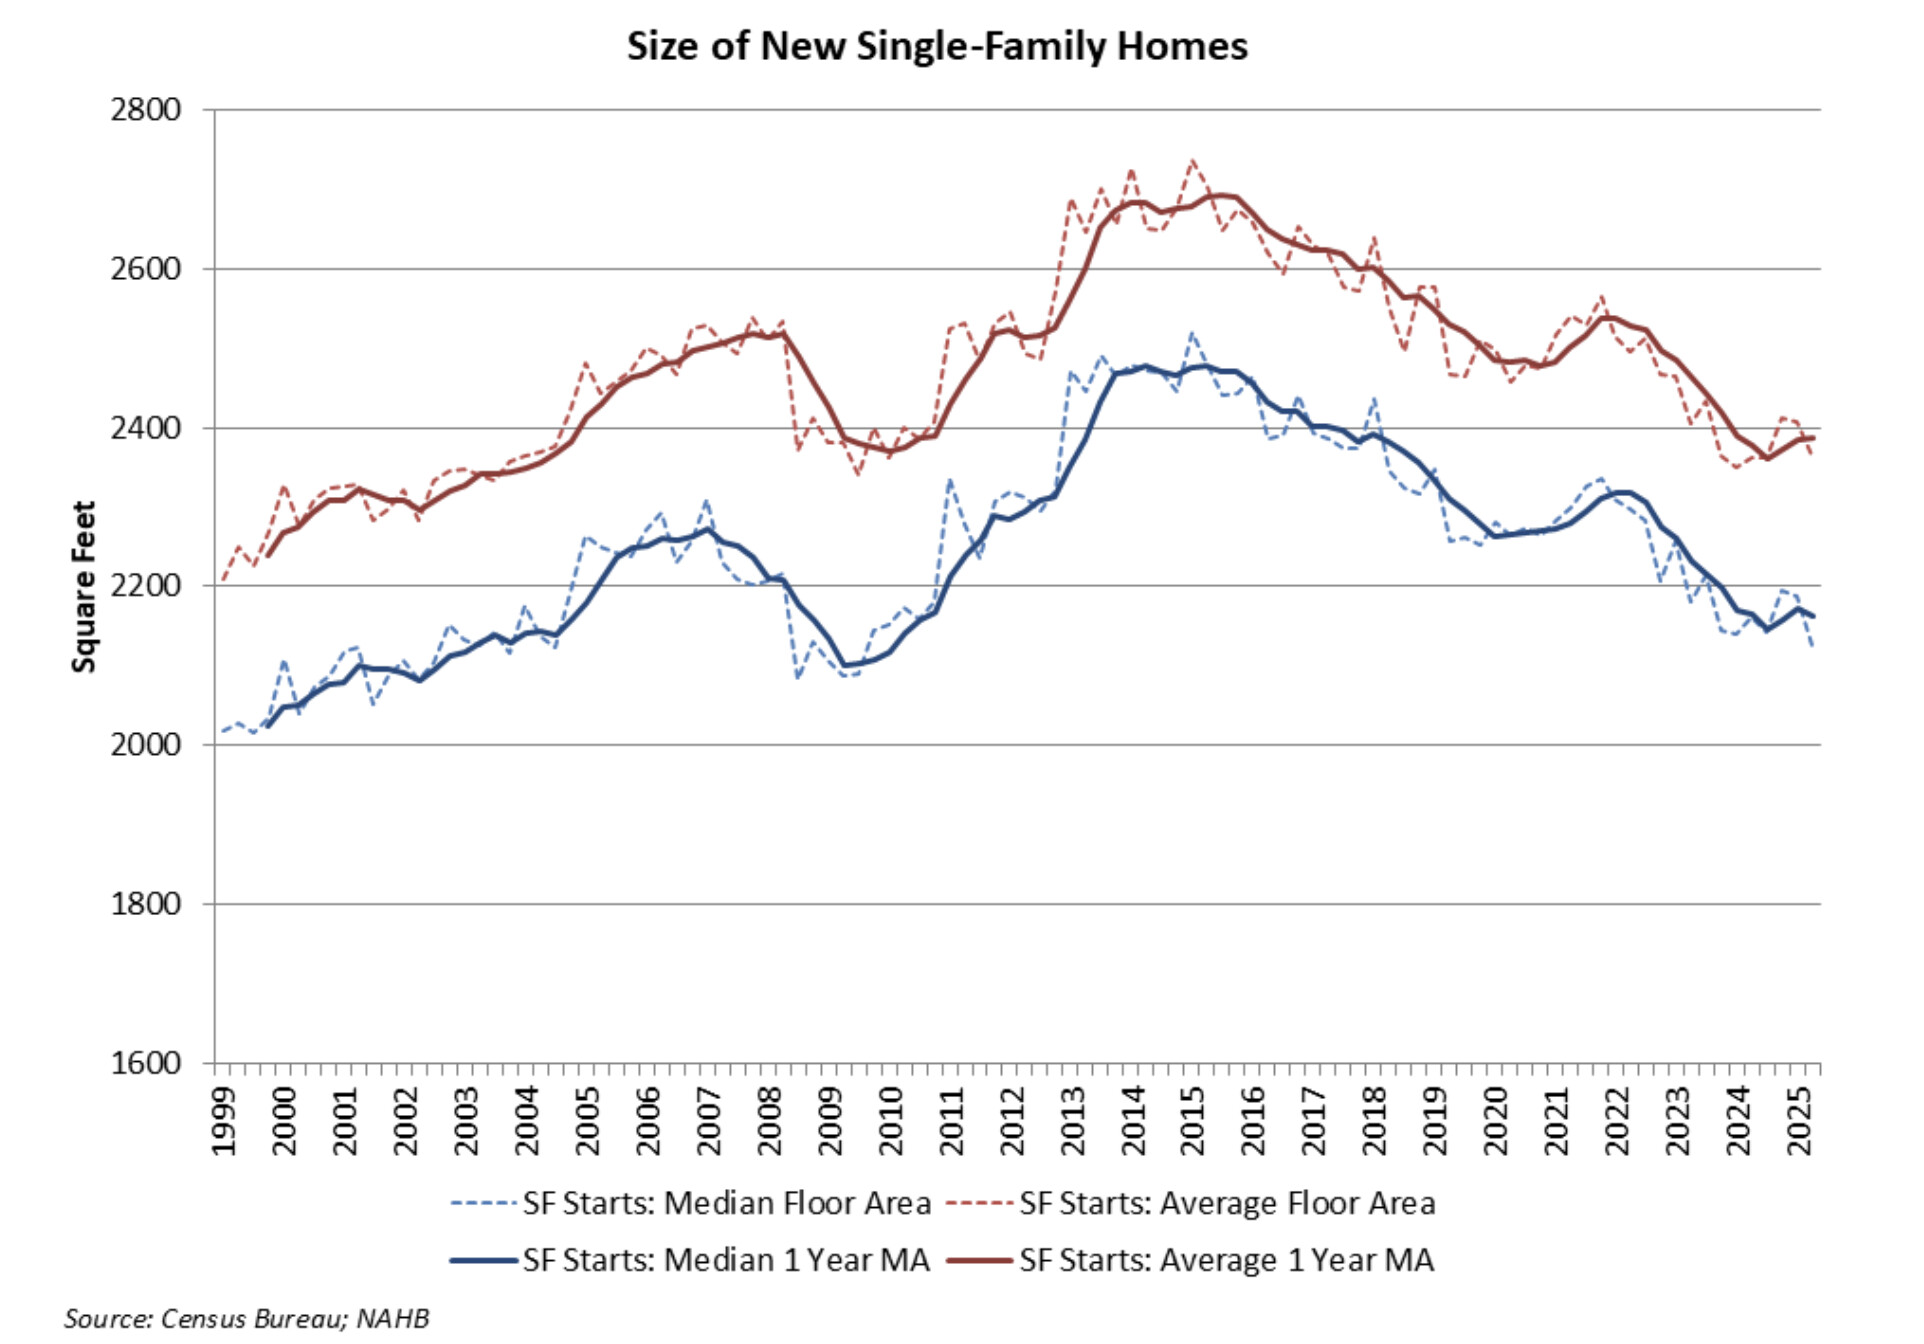
I am sure there is NIMBYism at work against more affordable housing in many locations, but there has to be a way to put a million worth of real estate on the same parcel of land that can hold a million dollar McMansion that isn’t a single home…and maintain the same margin. My current lot could easily fit two single family homes, but 20 years ago 4000sf was in demand, not 2000sf, so my home exists instead of two.
Well, that and the kept building shitty cars and basically conceded the market to Honda and Toyota.
It’s not the “margin”, it’s the nominal return on the land purchase. I agree with NS, and it is particularly pronounced in “good suburban school districts” parcels there sell for much higher prices than sketchy districts.
And the two school districts could be side by side. It’s just the arithmetic involved with a fixed cost. The construction loan for the rebuild is a bigger amount…it’s just the math.
Just giving my own anecdote here. Shortly after I was born, my parents bought our house for $65k (in 1983) and my dad kept his cheap condo. They were 28 and living off my Dad’s railroad salary while he studied for his masters degree. That same house with marginal improvements is now estimated >$350k. College was also much cheaper, so he didn’t have student debt.
Imo, the CPI is voodoo math.
There is definitely something to be said about overspending, but I think the affordability issue goes way beyond that.
CPI is macro.
Not applicable for each individual’s experience.
I have an anecdote about my parents. They sold a house in 1973 for $16,900. Sometime in the last 10 years (I’d have to go search to get the exact year) that house sold for $1,000. The owner(s) who bought after them lost money in total.
Housing is extremely sensitive to location. Anecdotes have a lot of subjective impact because we lived in these houses. But, there’s always one more anecdote.
(Yes, I’m so old that my parents sold a house in 1973)
The cost of housing is too damn high
1 Like
/thread
1 Like
Two things I haven’t seen mentioned are the effect of flippers and corporate investors on entry level homes. The AI bot tells me about 7 or 8 percent of new homes are flipped and about 8 percent of homes in urban areas are owned by large corporate investors. Last home I bought was about ten years ago. Flippers made for difficult competition as most decent targets didn’t stay on the market for more than a week.
7 Likes
Costs of healthcare as well (a big one)
Jersey City is pretty much broke because of them.
https://www.nytimes.com/2026/02/04/nyregion/jersey-city-budget-deficit.html?smid=url-share
I get that and was sharing mine as someone had given an example above about a house being the same price in 2026 dollars as it was in 2003 dollars. I assume your example of a house that sold for 1k isn’t a livable house?
Seems relevant…
1 Like
That’s a weird metric on top of cherry picked data points.
pre-Covid affordability is weird/cherry picked?
Yes, pick the low interest rate era after a long period of somewhat stagnant home price appreciation, right before a period of high inflation, and use that as a baseline for setting what % of income should be spent on a house, then translating that to an income level that keeps the % fixed at (im guessing) record lows.
If gas doubles in price, you need an extra $200 a month, not twice as much income.
Housing is currently at the upper end of the historical range. It was near the lower end in 2019. Prices will likely fall in the coming years as a result, or perhaps stay uninteresting and level.
Pre-Covid (2019) is a pretty widely used point of comparison. It’s also the end of a period that was generally considered to be affordable. It seems bizarre that you would consider using this year as the reference point as ”cherry picking”
I could see your point if they’d picked 1964, 1983, 2006, 2011, 2017 or some other year without explanation as potentially cherry picking the data, but 2019 is a widely used reference point right now. It’s from just before everything changing. Even without Covid, 2019 would be a popular year to use as it’s the end of the teens and the beginning of the 20s. Further as you note, it’s from the time period just before a period of high inflation. People would tend to want to compare costs to the low inflation period that was preceding the high inflation period.
I took the time to calculate “median monthly mortgage payment as a percent of median monthly household income” for calendar years 1984 through 2024.
Here are the 10 most and 10 least “affordable”
| 2020 | 32% | 2006 | 44% | |
|---|---|---|---|---|
| 2019 | 33% | 2024 | 45% | |
| 2012 | 33% | 2022 | 47% | |
| 2011 | 33% | 1987 | 47% | |
| 2009 | 34% | 1990 | 47% | |
| 2010 | 34% | 2023 | 48% | |
| 2021 | 35% | 1985 | 48% | |
| 2013 | 35% | 1988 | 48% | |
| 1998 | 36% | 1989 | 49% | |
| 2016 | 36% | 1984 | 52% |
Of course, someone else could find different sources for data and probably get slightly different numbers. I used the FRED series MSPUS, MEHOINUSA646N, and MORTGAGE30US
I assumed a loan of 90% of the purchase price and the annual cost of taxes and insurance equal to 2% of the purchase price. I did not make any attempt to adjust for the increase in house size over that period.
We happened to buy a house in 1981. Mortgage rates were even higher then.
2 Likes
I assume it wasn’t when it sold for $1,000. It certainly was when my parents sold it.
I’m pretty sure that somewhere along the way the owners figured out that prices were dropping in this neighborhood and decided it didn’t make sense to sink money into a property that was going to lose value anyway.