I think the total deaths and recent deaths are swapped on the interactive map at the link. NY shows an enormous peak in the one labeled “recent” and not in total.
Yeah, could be. I should check their github…
Actually, I’m wrong. Looking on a laptop (and not a tiny phone screen) the spike in recent deaths is centered around Detroit, not NYC.
Results In this study, total 58 patients showed the behavior of using spectacles continuously during day time and always on outdoor activities. The risk of COVID-19 was found 0.48 in spectacles wearing population as compared to 1.35 in population not using spectacles. The calculated risk ratio was 0.36. The protective effectiveness of the spectacles was found statistically significant (p-value .00113).
More evidence the vaccines work.
Vaccination data sources are getting weird. 91-Divoc by state has been flat for a couple of days. Johns Hopkins sheet is whacked out. CDC hub lags by 4 days. Anyone got a good summary site?
This site is only active for a couple more days as they are taking a lead from covidtracking.com and shutting down.
Some good maps with history there. can slide the bar to show changes in the past year that differ by state.
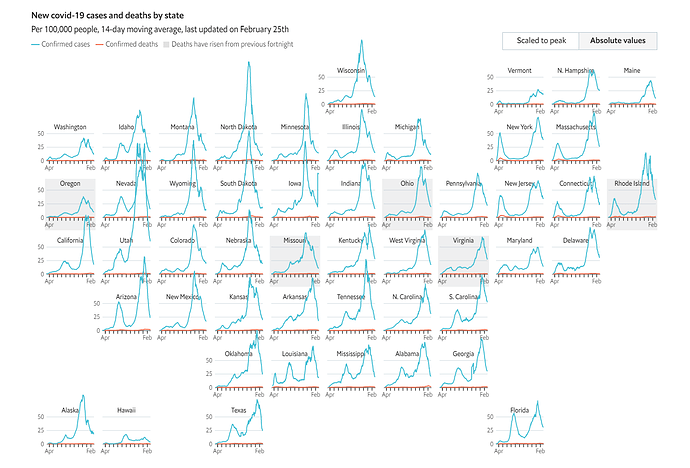
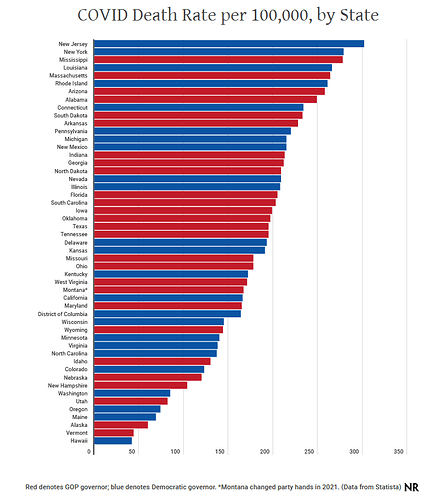
A variety of graphs and observations of the challenge of dataviz through the last year:
https://www.axios.com/graphing-the-pandemic-6b62e35a-8481-4287-bcab-70d4b2fc2091.html
AL’s vaccination effort is lagging national averages (only GA is worse on a per-capita total doses measure).
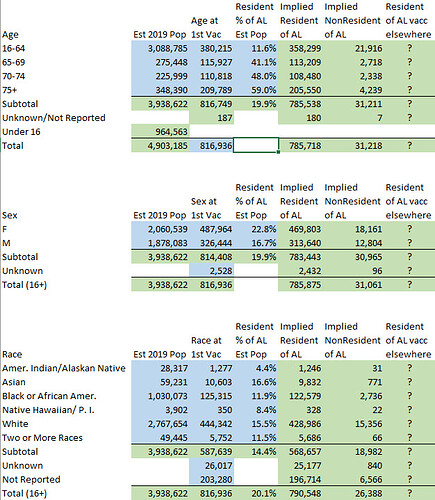
Stat’s website is a couple days stale, they seem to be changing format. It may not fully include the federal vaccination programs. The LTC program had been reported separately, and I don’t know if the federal pharmacy program is required to submit to AL DPH either. The demographic data they produce does reveal some positive signs.
- Age targeting has helped drive high rates among older folks.
- Racial disparities aren’t as bad as they could be, and geographic data shows strong outreach in rural, predominantly black areas.
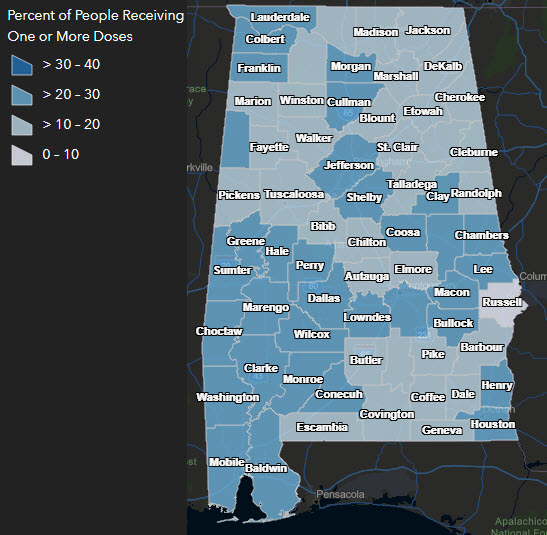
Here are a couple of pics. First vac data. Blue data is from ADPH site, green is implied.
County level map shows the SW counties, which are small in pop and heavily black, are getting good initial uptake, and with the exception of Huntsville, the major pop centers have higher rates too.
ETA- I didn’t include ethnicity relating to Hispanic since data was sparse, and our Hispanic population skews young.
Back in the spring of 2020, I volunteered for a national blood survey attempting to find out the spread of undiagnosed COVID cases. They had excess volunteers so I was not chosen.
As a volunteer, they sent me a link to their results as a courtesy. Between May-July last year, roughly 5% of people had COVID without being diagnosed
3 weeks ago, the Florida DOH randomly changed deaths from “date reported” to “date of death”, which introduces a lag that looks like a trend downward towards zero even when everything is on fire. Naturally, they didn’t bother telling anyone.
I have been wondering what the hell happened to their data for sometime, glad to finally know.
https://www.miamiherald.com/news/coronavirus/article253796898.html
You mean they reported data on the deaths the way you’re supposed to?
Tsk tsk.
I never look at the “date reported” graphs, because they’re bullshit.
Piece on the Florida reporting change:
a point:
The downloadable data sets on cases and deaths included the report date as well as the date a person died or got sick, allowing journalists and independent researchers to select the best metric for their purposes. The daily reports showed additional cases and deaths added from one day to the next.
In June, as case numbers dropped and vaccination rates continued to rise, the health department discontinued the dashboard and changed to a weekly report. The only near-daily data was submitted by the health department to the CDC and published on the CDC Trend Tracker website.
Switching from daily to weekly is more pertinent to me than that they have changed the official state-hosted dashboards. So I would get them on not releasing daily reports, which is kind of important given their current surge. They’re going to be having these surges every summer (as in 2020 and 2021), so they should have proper systems for that.
I’m so looking forward to the winter surge we’ll get again in the northeast.
I mean switching data definitions without alerting anyone that you are switching definitions.
And doing so during an emergency, when it makes it look like there is no emergency.
And doing so when the country is trying to figure out Delta’s death-rate.
Switching from daily to weekly is nbd, since you can see the curve anyway… except that it’s extremely annoying for no reason at all.
Maybe this belongs in the “annoyed thoughts” thread. But the NYT just published a long, informative article on “how much protection do you get from vaccines”. Except that I clicked through to their source (kudos for including it, I guess) and the data appears to all be pre-Delta.
So, pretty much useless.
Here’s something more useful, although it focuses more on the efficacy of a third booster dose than on exactly how much protection two doses gives.
How much Delta data was included in whatever the FDA based its Pfizer approval on?


