I’ve probably mentioned this article a long time ago, and I decided now was a good time as any to revisit it: “The Single Greatest Predictor of Future Stock Market Returns” written in 2013.
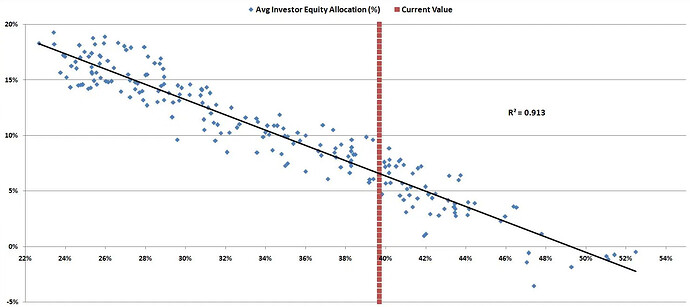
I think the indicator is the percentage of all US assets that are invested in equities. That ratio can be pushed upwards in the current scenario if everyone bids up the price of equities finding nowhere else to get a good return. The author then shows that the higher this ratio, the lower the future return. It is a nice straight line with an R^2 of 0.913.
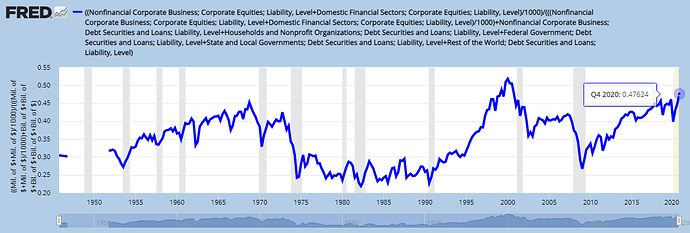
The ratio is calculated here and is 0.476 which is the highest since before 1950 with the exception of the bubble of 1998-2000 where it peaked at 0.518 before popping and retreating to 0.358 four years later. At the low of the 2007-2008 recession it bottomed out at 0.267
The author doesn’t provide the exact formula but gives a graph from which it could be estimated here:
If we go over to 0.476 and go up to the line, the formula tells us to expect a 1% return for the next decade. And quite a lot of the dots are within 2-3 percentage points of the line. My ambitious retirement plan assumes a 5% return on investments so perhaps I won’t be retiring quite as soon as I’d hoped…
I don’t know how the pics will turn out I’ll try putting them on a separate post.
Here is the graph showing the 0.476 ratio:
and here is the linear relationship:
You can get better close-ups using the links in the previous post.
Thoughts?
Ah so lower prices lead to higher future returns and vice versa. How remarkable. /s
I think it’s a bit misleading, though. (Note, I haven’t read the article, yet. But want to throw out what’s hitting me first that I’d be checking when I read the article.)
What types of investors are included in the study? Are “market funds” (where allocation is done by an “expert” and not the investor) included?
Is “age of investor” included in the study? For example, younger investors might be willing to put higher percentage of a smaller total dollar amount in equities with a multi-decade view to financial growth; while an older investor (one near retirement) might be putting the same dollar amounts as the younger investor in equities but this is a smaller percentage of investment since they have more capital to invest.
Is there a minimum capital requirement of the investor to be included? I can see where an investor with limited funds available for investment is required to put “most” of it in equities (if desiring to invest in equities). Also, are investors that invest nothing in equities included in the study?
Investor Allocation to Stocks (Average) = Market Value of All Stocks / (Market Value of All Stocks + Total Liabilities of All Real Economic Borrowers)
I don’t think this is meant to profile a particular investor; this is meant to evaluate the US stock market as a whole. Assets that are not in equities are in cash or bonds, and a bond is a liability to someone.
Thanks for the added info.
So . . . get more on your returns by borrowing a ton of money??
Because such a large percentage (47%, the historical average is more like 35%-40% and a lower bound is about 25%) of US “money” is tied up in stocks (bidding up the stock market) a linear relationship tells us to expect a 1% return for the next 10 years.
My point is that the formula given appears to be moved by a choice of debt as well as “market price of stocks”.
So, companies are likely to borrow more when a recession (and depression) is going on.
Put another way, it appears that the data is merely correlational; not causal.
The top chart is interesting in that the blue line is increasing (generally) when the economic outlook was very much favorable. Sharp declines during the 1970’s oil crisis and the housing bubble burst. Increases during the Clinton Presidency (Desert Shield & Desert Storm).
So . . . when gov’t spending increases drastically, people invest in stocks more readily.
If the ginormous Biden infrastructure package passes, that 0.476 number may see a precipitous drop. I doubt that the numbers available hasn’t reflected the latest economic stimulus package to the total.

