Could they use speed cameras?
I think there are different problems going on here.
There is the “the everybody traffic” problem.
and the “specific people” problem.
There are specific people causing a hell of a lot of trouble in general.
I knew about this issue re: NYC, because it DOES have cameras, and there are specific vehicles that have amazing stats on them.
Speed cameras, red light cameras, and even noise cameras. If you’ve been in New York City, you’ve seen them. They’re practically as ubiquitous as overpriced coffee shops at this point. Last year, these cameras handed out thousands of tickets, and get this: more than 500 went to a single driver who has racked up over $50,000 in fines over the past few years.
…
In 2024 alone, this driver accumulated a staggering 563 tickets. The majority of those were for speeding, with a particularly troubling 626 violations in school zones between December 2023 and November 2024. And let’s not forget about the handful of tickets for driving in a bus lane or running red lights. As *Jalopnik *pointed out, this same Audi A6 driver also managed to rack up 7 speeding fines in a single day, totaling $350 in violations.
On average, that’s 1.54 tickets per day, with each fine clocking in at a minimum of $50. In total, the Audi A6 driver has accumulated $58,149.57 in fines, of which $46,636.60 has already been paid.
I guess NYC is happy to have the $$
Not that everybody pays
And it’s not just this person either. Another driver in a Mercedes-Benz picked up 474 tickets last year and currently owes the state $47,858.17 in unpaid tickets. According to the report, the majority of these super-scofflaws simply ignore the fines rather than pay them because, since they’re not handed out by an NYPD officer, they don’t carry points. That means these drivers can just keep on driving until the state steps in to do something more serious.
1 Like
I can’t remember if I already posted this map somewhere else, bc I remember seeing this when it was originally posted in April
maybe I used it on my substack
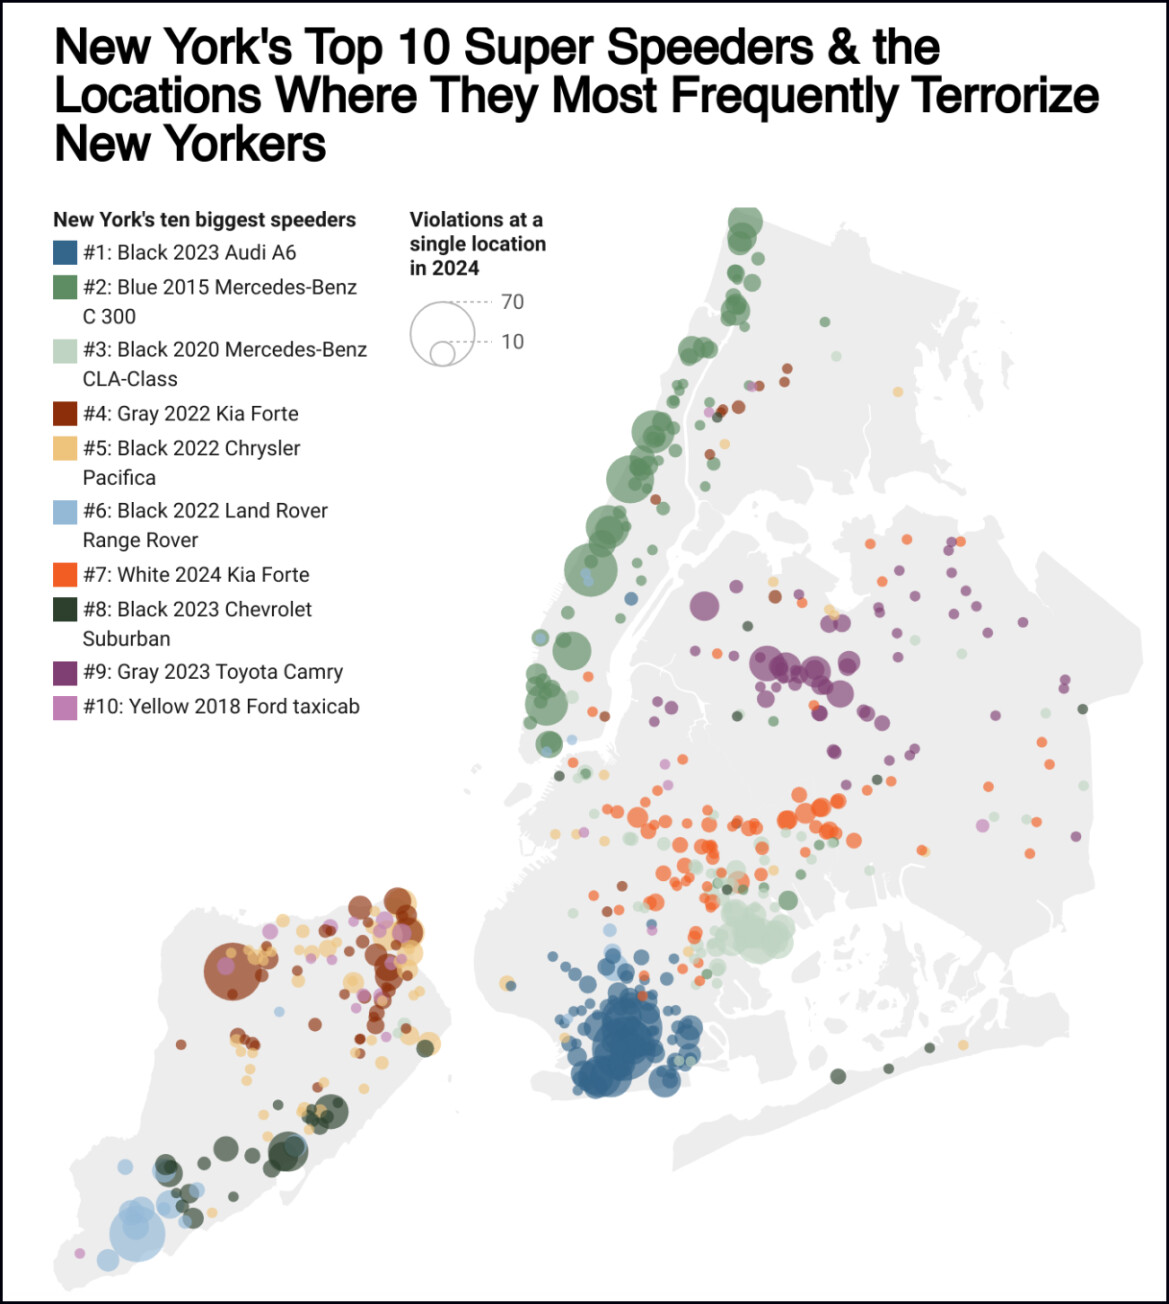
It’s all over NYC, so nice to see diversity here
1 Like
Not to be a contrarian, but:
Where are they hitting these people? I can understand if they were on the sidewalk or in their own homes.
Not sure what happened in the past 40 years, but people think walking across a street is safe, like there is a Cone of Indestructability around them, and many, if not a majority, of crosswalkers I see do not have their heads on a swivel at all. Me? I’m staring down the driver of every moving car until they acknowledge me. I am checking farther down the street.
As the wise and living bicyclist says, “You might have the right, but you might also be dead.”
1 Like
Here’s some swivelless heads along the Sydney light rail network, especially 1:20

Here is an example story:
2 killed in NYC's Chinatown when driver hits cyclist, pedestrian - CBS New York
2 killed in NYC’s Chinatown when driver hits cyclist, pedestrian
By Kristie Keleshian,
Updated on: July 21, 2025 / 5:19 AM EDT / CBS New York
Two people were killed when a driver struck pedestrians in Manhattan’s Chinatown Saturday morning.
It happened at around 7:30 a.m. at Canal Street and Broadway.
Police say the driver of a blue Chevy Malibu was speeding westbound on the Manhattan Bridge and, once in Manhattan, struck a male cyclist and a female pedestrian sitting on a bench on the sidewalk, as well as an unoccupied NYPD van.
They say “pedestrian”, so you think it’s somebody walking, but no, it’s somebody just sitting on a bench.
This driver was problematic, to say the least:
The driver, Autumn Donna Ascencio Romero, was charged Monday with murder, manslaughter, vehicular manslaughter, aggravated vehicular homicide, criminal possession of a weapon, leaving the scene of an accident and criminal possession of stolen property.
Passenger Kennedy Lecraft, 22, was charged with two counts of criminal possession of a weapon, criminal possession of stolen property and unauthorized use of a vehicle.
So high speed and losing control of a vehicle that one has possibly stolen is something… or maybe they just “borrowed” it.
Here is another type, where somebody is in an intersection:
They mention the issue of “daylighting” - the fix for the problem here, where both the pedestrian and the driver would have difficulty seeing each other.
The intersection is wide with two-way traffic on both streets, and left-turning drivers often blocked the view of pedestrians crossing at the intersections. Cars park right up against the corner because there is no restriction on vehicle storage there to clear sight lines, a design known as daylighting.
The youngster’s death adds to a horrible tally of traffic violence on the city’s streets. She is the 15th child killed by drivers so far this year, the second-highest rate at this point in the year since former Mayor Bill de Blasio launched Vision Zero in 2014, according to advocates with Transportation Alternatives.
“Absolutely no one should fear death or serious injury just walking around the city they call home, and New York can do so much more to keep our youngest and most vulnerable pedestrians safe,” said Philip Miatkowski, Transportation Alternatives’s senior director of Research and Policy. “This intersection was designed to be dangerous, and it’s time for the city to prioritize New Yorkers instead of falling even further behind on the daylighting promises it made when another child was killed only a year ago.”
But yeah, if I were driving blind around an intersection, I wouldn’t be going full tilt that I might be going ker-blam into somebody crossing the street, knowing that’s pretty common in NYC.
Most places I used to live, one would not be able to park right up to the intersection for safety reasons (that line-of-sight issue). But evidently, that’s not true everywhere in NYC.
By the way, this is a good reminder that I said I would revisit to see how the congestion pricing was going, so yeah, I’ll put stuff together (not just accident stats).
Housing is getting expensive, but I wonder how much of that is driven by the shift in WFH over the past decade accelerated by COVID. Additional bedrooms now have additional uses beyond a place to put a bed. A couple bought the 4-5 bedroom house a few doors down from me in early 2021…sure they were planning on having some number of kids, but they both worked at Microsoft and went remote during COVID, so moved to a lower COL area and helped drive up home prices.
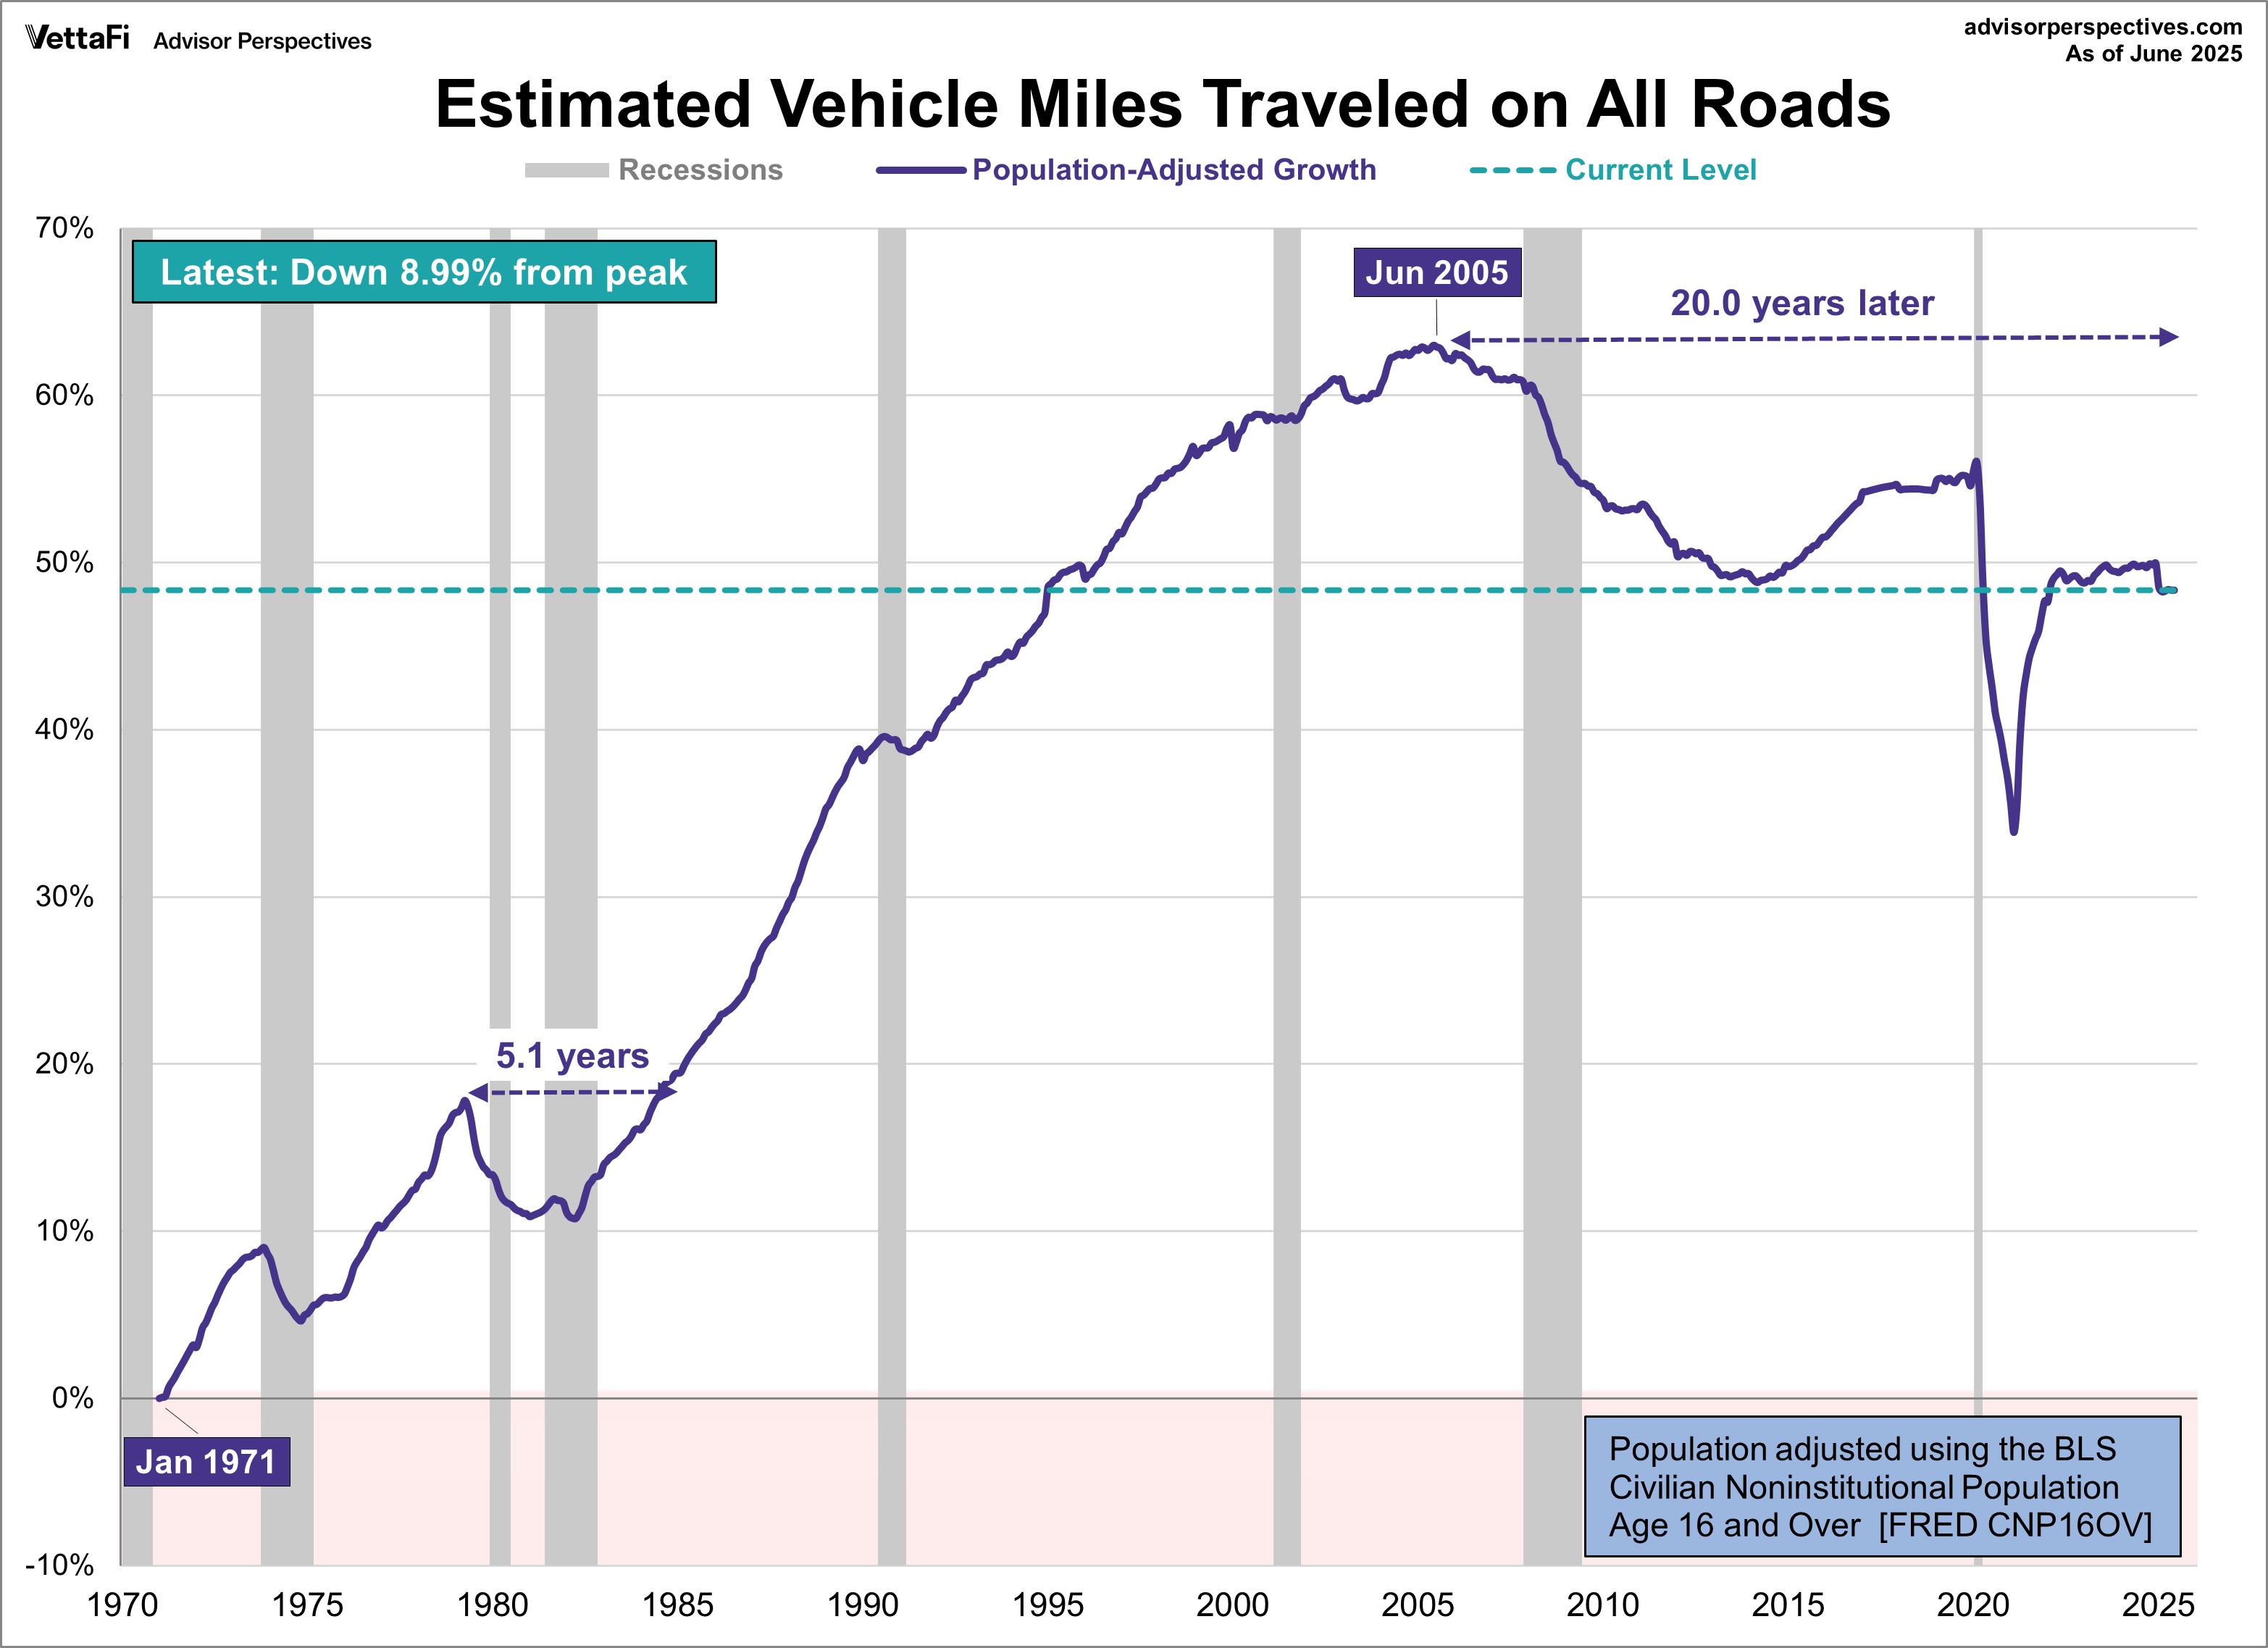
You can see some of this in vehicle miles driven that dropped during COVID and never fully recovered. Car sales have also been dropping, but price and longevity of newer cars are additional factors there.
https://www.advisorperspectives.com/dshort/updates/2025/08/28/miles-traveled-june-2025
There is a real shift in consumer preferences. People are trading miles driven for an extra bedroom. Yes, a house is now more expensive, but there is an offset in commuting costs. That should be a beneficial tradeoff if the total cost is neutral.
As an actuary, I cant help but wonder how they are estimating this.
Maybe using “gasoline sold”?
And why is it a “%” on the y-axis? Percentage of what?? Percentage higher than 1971? Is the percentage a total? Or Per person?
Not sure if the purchasing of new cars is relevant. Either someone drives some amount of miles or they don’t. It’s possible that if people stop driving (like, say, a giant, some would say booming, part of the population is now retired), then sure, they would be less likely to replace a car with one they wouldn’t drive as much. Making a sound investment there, as cars are usually purchased in order to earn a living or get to the place where one earns a living. People stop working and people don’t need to drive to work.
More details at the link, and yes the chart is a bit confusing without it.
AI Overview 1
The average work-from-home (WFH) days for office workers vary, but for those in remote-friendly jobs, recent data from 2024 and 2025 shows they work from home around 2.2 to 2.3 days per week. However, when considering all office workers, including those in hybrid roles and those who only work in-office, the average WFH days are lower, with some data suggesting around 1.4 days per week across the entire workforce in 2025."
AI Overview 2
As of 2023, the average U.S. household spent $6,440 per month, totaling $77,280 for the year
. Data from the Bureau of Labor Statistics (BLS) shows that housing, transportation, and food were the largest expenditure categories.
Average monthly household budget breakdown
Based on 2023 BLS data, here is how the average household budget typically breaks down, along with average monthly costs:
- Housing: $2,120 (33% of spending). This category covers a household’s largest expense, including mortgage or rent payments, utilities, maintenance, and furniture.
- Transportation: $1,098 (17% of spending). Expenses include vehicle purchases and payments, gasoline, insurance, and maintenance costs.
So…
A 25% reduction in commuting costs can offset a ~13% increase in housing costs. The point is a real consumption shift happened that added value to housing as it now doubles as a work environment.
While there is some truth to the article, biased article is biased.