I’m researching RBC Data for P&C Industry, and came across the NAIC compiled Aggregated P&C RBC Data.
If you look at the linked report, the bottom section has “Total Adjusted Capital” which I understand to represent the net worth of all P&C Companies that filed reports (assets minus liabilities).
The next field is “Authorized Control Level RBC” which I understand to mean the minimum required capital buffer.
RBC % would be the ratio of adjusted capital to required capital (ACL RBC).
The part that I don’t understand is the next section with Total R0, Total R0A, … all the way through Net Basic Operation Risk.
Let’s look at YR2024, those values don’t seem to add up to Total Adjusted Capital, nor do they add up to ACL RBC.
What do these values represent?
I just looked at the exhibit and CuriousGeorge’s comment is the right one.
I’m not familiar with the R0A/R1A/R2A… “A” items, although they’re all NA in the exhibit.
The other rows, R0-R5 and RCat appear to be industry-aggregate values for those elements of the P&C RBC formula. They’re the results of the calculations for the various components of risk considered in the RBC calculation.
I’ve done more research and have asked claude regarding this.
The P&C RBC Instructions say to add R0 + sqrt( sum of squares(R1-R5 and RCat) + R_OperationalRisk.
However, I’m getting 196.7B when the listed ACL RBC is 227.9B.
If anyone has insight or suggestions for how to reconcile it would be much appreciated!
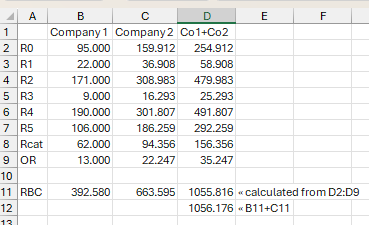
I suspect, but don’t know for certain, that the exhibit is showing aggregate values for RBC and aggregate values for the components of RBC. However, because of the diversification mechanic in the calculation of RBC, you can’t assume that AggRBC = AggR0+SQRT(AggR1²+AggR2²+AggR3²+AggR4²+AggR5²+AggRCat²)+AggOR
You can test this with a simple example of two fictitious companies, where the relativity between the two companies’ R-values is not uniform.