More theater:
Legal Eagle video on the Texas situation:

Two additional items, from the video, to what’s been written above:
- There’s legal action afoot to have the Texas Dems removed from office for having abandoned their seats, although there’s some additional drama on the legal dance being done there.
- Precedents for breaking quorum include Abraham Lincoln engaging in some self-defenestration.
New York Times opinion piece today.
https://www.nytimes.com/2025/08/12/opinion/math-solution-gerrymandering.html
“Geometry Solves Gerrymandering”
I don’t know if there is anything brilliant there, it’s just interesting to see the visibility.
The author wrote this paper: https://fryer.scholars.harvard.edu/sites/g/files/omnuum5986/files/fryer/files/measuring_the_compactness_of_political_districting_plans.pdf
But, the piece is not suggesting states actually adopt most compact districts, just that there is some general feeling that they should justify (to whom?) deviations.
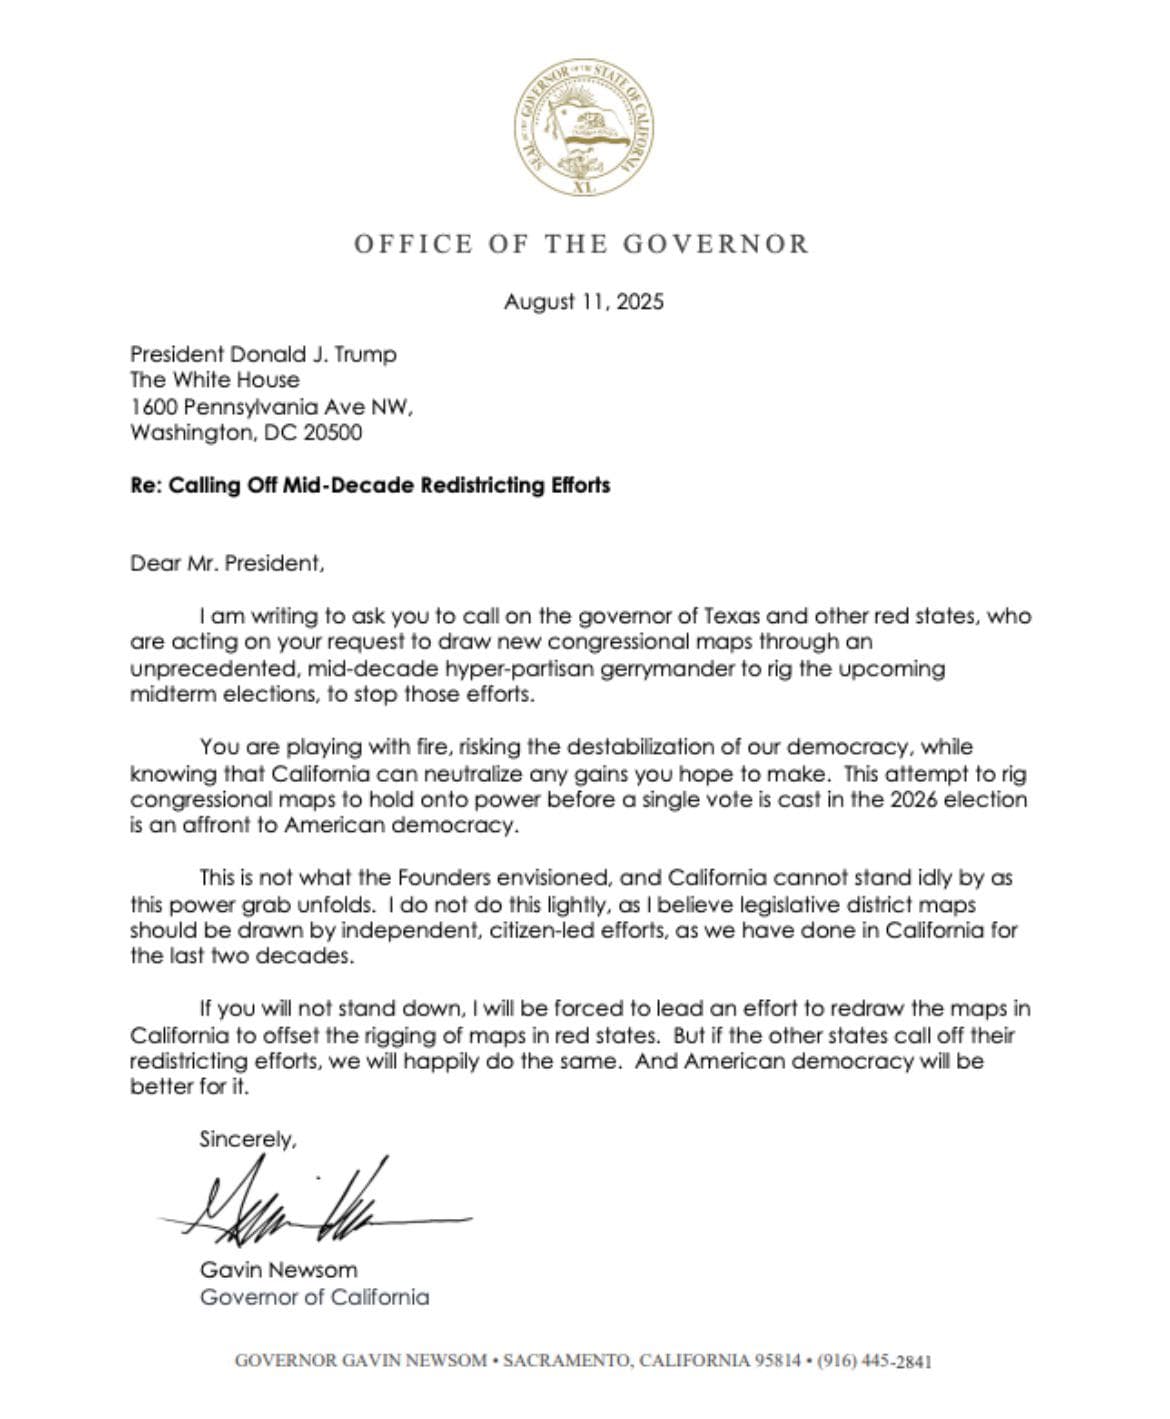
Apparently someone in Newsom’s office realized that Dear Leader likely doesn’t actually read letters.

1 Like
It is interesting to see, though last time tried math, Roberts referred to it as “sociological gobbledygook”.
https://www.nytimes.com/2018/01/15/us/politics/gerrymandering-math.html
1 Like
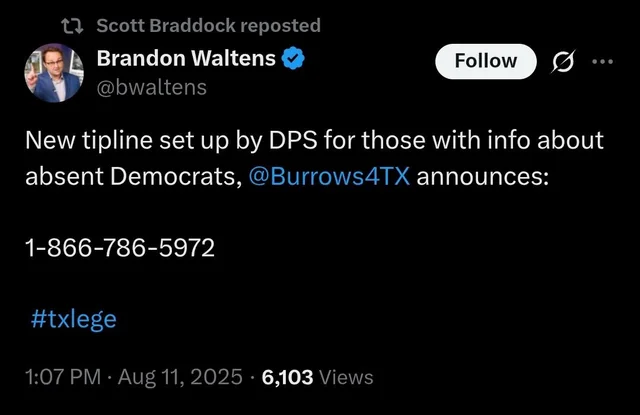
Not a surprise and I’m disgusted that we’re heading down this path…but I understand why, and I appreciate the style of the announcement:

I just worry that people will miss the joke and just figure that Newson is finally talking like a man of the people.
2 Likes
I couldn’t resist following up on the “Geometry Solves Gerrymandering” article.
Their method is based on Census tracts. Assume all the population in the tract is concentrated at the geographic (not population) center of the tract. That gives a map with a bunch of dots. Randomly distribute n other dots on the map. These are the “centers” of districts. Each tract is assigned to the district with the closest center. Districts will not have equal populations. Re-assign tracts one at a time to get to equal populations. This creates new districts with different centers, repeat with these new centers.
“Compact” is determined by adding up all the pairwise distances within a district, and they adding up all those district numbers. Lower numbers are more compact.
That’s a fine method to me, the problem is that they don’t stop and just take the most compact map. They then say that “somebody” is going to draw the real map which can’t be too non-compact. That’s too fuzzy for my taste.
1 Like
Agree, but it’s also a recognition that compactness, a desire to respect city/county boundaries, a desire to not divide “similar” communities (e.g. “posh suburbs” vs “blue collar neighborhoods”), and the need to avoid disenfranchising certain minorities that have a different geographic distribution than the population as a whole potentially conflict.
It should be possible to have an algorithm that maximizes compactness, does the right thing with avoiding minority disenfranchisement, and has a scoring algorithm to favor lines that run along municipal boundaries…but opinions will vary on how precisely those latter two should factor into the algorithm’s calculations.
I don’t know that we can currently algorithmically avoid dividing “similar communities”, although I suppose with recent advancements in machine learning we might be getting close to having a way…although here too opinions will vary.
The “opinions will vary” and the limitations of current algorithmic tech arguably degenerate to “a human has to draw a map”. And that’s why I’d be content with a system where qualified parties propose maps and, after filtering for those maps that satisfy civil rights concerns, the map with the best compactness metric is the one that is selected.
If we can specify those concerns in advance, so that map makers can plan for them, I’m on board. For example, maybe the VRA says there should be at least one minority majority district in a certain county. Anybody proposing a map can allow for that.
“I’ll know it when I see it” is a different problem.
Note that “When first established, census tracts are to be as homogeneous as possible with respect to population characteristics, economic status, and living conditions”. Things have changed, but I expect some of those things still hang on. Also, census tracts never cross county borders.
This is fundamentally a bad thing.
Common Cause, an advocacy group that has been pushing for states to adopt independent redistricting commissions, has an extremely reasonable response under the circumstances.
Source: https://www.commoncause.org/articles/our-response-to-mid-decade-redistricting/
Up until a few days ago, they were opposing Newsom’s plan, for the obvious reason, and their opposition could likely have made a difference in CA. They’re instead choosing to adopt a more pragmatic and principled stance of “we can’t endorse this idea, but if we oppose this the alternative is much worse.”
I should note, however, that the Texas GOP has said they will end the current special session. The Dems who have fled the state are waiting to see that it really is ended before returning.
That doesn’t mean that the Texas GOP can’t pull a fast one later, or that other red states might attempt some mid-cycle shenanigans…but for now, the threat is eased.
It’ll be interesting to see the language that is put on the ballot in CA in November. I would hope that there is some conditionality or time-limitation, constraining CA from deviating from its current process except in exceptional circumstances as TX created…but I doubt that’ll be the case, and that definitely would be a bad thing.
Iirc, tx special sessions have a time limit, but the gov can call another whenever they are out of session.
TX democrats have returned b/c California has pledged to counterbalance. Meanwhile Democracy loses.
1 Like
Nerding out on mathematical redistricting.
Markov chain Monte Carlo simulated anneal. That’s a mouthful.

1 Like
I mentioned above that somebody had pointed me to an example with NC. I didn’t recall where it was, this is the guy. Yes, the algorithm is fascinating.
The NYT article I posted had their own algorithm, but there are some overlaps. In particular, I recall the initial step of randomly locating “centroids” for the initial districts. The NYT guy moved the centroids around and ended up with maps that were simple polygons.
My takeaway is that there are multiple algorithms that could work. I suspect that all of them are sensitive to the initial “seed”. You can claim to have found a local maximum, but it’s hard to claim a global maximum.
If I wrote the law/amendment, I would not have the gov’t draw maps. I would crowdsource them. Multiple people have already done computerized redistricting, they can all submit their best maps.
I would go with an extremely simple standard. e.g. All maps are created by assembling US census tracts into contiguous districts, and all maps must have district populations within 1% of the state average size. For maps that satisfy both requirements, calculate a compactness number based on some rule*. The most compact map wins.
A big advantage of this is that it can’t be gamed. People who built map algorithms can check the winning map and see if it really is more compact than than the one they submitted.
The redistricting commission provides a database of census tracts, a way to upload/download maps, and an engine that calculates the population and compactness numbers.
’ * The rule could be based on distances of people in a district from other people in the district. As the video points out “distance” can be defined. Or, it could measure the perimeter of the districts. In the perimeter case, the commission would need to replace census tract borders that follow rivers or are otherwise curved with straight lines (only for the purpose of the calculation).
The Texas House is apparently taking steps to ensure that quorum will be achieved.
What would happen if we allowed each voter to pick a direction, North, South, East, or West, to select their preferred district, then put each voter with their address and vote into a computer that then determines the optimal agrgegate preference?