some might say…we’re beta
How is “poverty” to be defined?
I have a feeling that this definition is quite different 100 years ago (let alone 500 years ago) than it is today. Based on this, we’ll always have “poverty”.

3 Likes
In the 1960s CEO pay to worker pay was roughly 21 to 1. Today it’s roughly 351 to 1. But can vary wildly by industry from industry to industry with some rations closer to 60 to 1 all the way up to 22,000 to 1.
For the S&P 500 it’s a bit narrower range of roughly (100 - 325) to 1 but still 5 to 15 higher ratios than 50 years ago.
https://www.fwcook.com/Blog/2022-CEO-Pay-Ratio-Among-SP-500-Companies/
I think this is a good measure to look at for a point in time measure of where the payroll is spent and a trend metric to help identify when things get out of whack.
Pretty sure it started in 1978, picked up steam in the 80s and went hog wild in the 90s and has never come pack to reality.
4 Likes
I tried to avoid defining poverty in this thread as there are so many different ways to define it by country and there was another GoActuary thread dedicated to this question. However the World Economic Forum, which is a boogeyman to the Right, has a standard definition it employs solely for international comparisons. That metric, along with measurements such as the Gini coefficient, at least provides a comparison about how income is distributed by country.
As we know the US has the distinction of being the richest country in the world but with an income distribution very skewed to the wealthy. Some will argue that the US is the richest country in the world BECAUSE of how it disproportionately rewards its successful people. I would argue that the US could continue to be the richest country in the world AND have a fairer income distribution because it has many other economic advantages. If we go back to the 1970’s and earlier, the US was still very rich but had a fairer distribution of income.
2 Likes
Part of my point in the prior post of asking that question isn’t so much as to have such a definition WRT “what does it mean today?” as to point out that its definition is really a moving goal post over time.
I would also ask the question (in the same vein) of “who determines the definitions?”
For example, when bringing in terms of “fair distribution of [fill in the blank],” who determines that definition of “fair”? One of my biggest pet peeves is when any side views the other side’s definition as being “greedy” and don’t bother to sit down and seek out–and equally important, recognize–the valid points of the other side.
2 Likes
That’s some peoples dream, or so they say. I don’t think, in practice, that’s most people’s dream though. People work because they want more stuff. It’s sort of like how just inflation adjusting doesn’t actually do justice to how things were different over time. On an inflation-adjusted basis people have a lot more and better stuff today than they had decades ago. People work long hours to continue to have a 2023 1st world standard of living. In 2050 they’ll keep working long hours to have a 2050 standard of living. I’m sure in 2050 they could work 2 hours a week and have a 1920s standard of living but no one actually pursues that in practice.
2 Likes
That article misses the crux of the problem.
The two MOST important determinants of your financial success are:
- Parental Income
- Grandparents income
After that…
- Education
Its not the expense side that is the problem (allthough I do agree with the author that low income people get financially abused), it is the background part that creates the imbalance.
I studied this for a long time (income inequality), and if you combine (1) and (2) above, with assortative mating (people will tend to marry others with similar socio-economic backgrounds), the probability of reducing inequality is basically close to zero. The system essentially becomes self-perpetuating as a sub-set of the wealthier people will keep extracting from the poorer people.
The only factor that nudged this in the opposite direction was education. The reason why is that it was only at University (when it was cheaper) that people from all kinds of socio-economic backgrounds could meet and socialise in an “equal” way. The end result was that the coupling off at University was more equal: you got low income folks marrying higher income folks due to their shared experiences at University, as well as BAME folks marrying white folks etc. This then helped drive social mobility up and inequality down, which then had the effect of reducing poverty levels.
The problem now is that education has become so expensive that factor (3) mostly just drives inequality up and not down, due to tertiary education being closed off to lower income folks (due to cost). So now, you mostly get assortative mating between higher income socio-economic groups at University, which keeps inequality high and social mobility low.
Thats the crux of the problem. One of the keys to improving social mobility and reducing poverty is access to affordable education. If you cannot provide this at a societal level, there is no real hope of reducing poverty levels by any appreciable degree.
4 Likes
or encourage rich people to marry poor people
I’m not sure that this would be very accurate in America.
I agree that in “the Old Country” (e.g., Europe), this could very well be the case. And, in fact, your first two items are very likely to be the biggest influence to the end result of how much–and what kind of–education an individual is likely to get.
However, with student loans pervasively available in the US, ancestral income isn’t going to be the primary determinant of what kind of education one could get . . . however, this can also be a big part of the net income problem for many Americans (disproportionately large gap between student debt and wage income).
What I will agree to with the listed influences are the type of jobs one is likely to get in terms of “executive” level opportunities. So, if you’re defining “financial success” as “7 figure (wage) income,” then I agree with what you wrote down here as being highly influential.
However, if “financial success” is defined as “(wage) income meets needs and is well above inflationary pressures” (which, I think, would be far closer to what most would use for a definition), then I would say that the greater influences are:
-
Career choice
-
Access to “low cost” education for the given choice (“low cost” == debt : starting wage ratio being “small”)
-
Ability to network within the chosen career
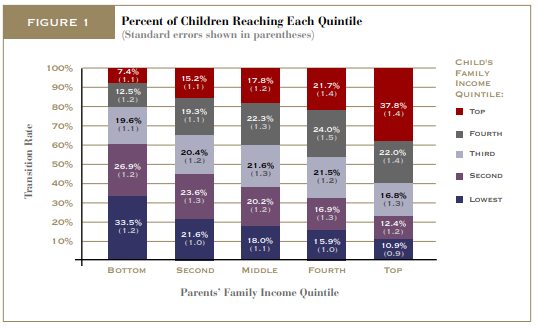
Wouldn’t this though suggest that the ability for lower income people to rise up the income ladder be high? Thinking specifically of the charts that show the likelihood of a person born to parents in the bottom income quintile making it to the top income quintile (kind of the American Dream idea). America is actually quite bad at this relative to the “old country”, I think the US parental income is potentially more predictive than in many other 1st world countries.
3 Likes
3 Likes
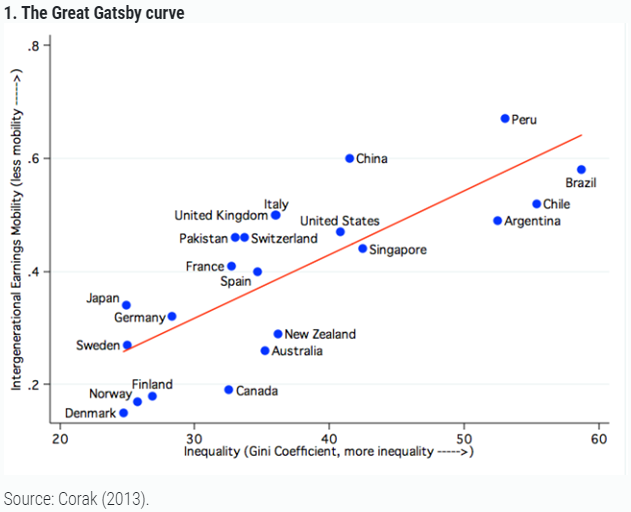
See the ‘Great Gatsby’ chart here (edit: and I’ve pasted the image below): https://www.chicagofed.org/research/mobility/intergenerational-economic-mobility
To @NormalDan point, I’ve seen those Markov style models as well, the US doesn’t have as much mobility as many EU countries, and the Nordic countries set the standard for mobility.
I recall @The_Polymath claim that your grandparents’ income is a strong predictor, which makes sense. If your income is correlated with that of your parents, and your parents’ income is correlated with their parents, it’s a daisy chain. But I don’t see models including that. Might be hard to get data back that far.
1 Like
I agree that this is the “American Dream” . . . and one that, IMO, is unrealistic.
I like the chart you provided, but it seems that too much attention is made about that “top quintile”. I find it interesting that 2/3 of those in the bottom quintile had moved up and an approximately equal percentage of the top quintile moved down.
The one thing I’d be interested in seeing in that graph would be the distribution across the buckets, including a count in each one.
2 Likes
I’ve seen similar studies, I believe Parental Wealth is even more predictive than Parental Income but I think there is often a pretty high correlation between Wealth and Income.
2 Likes
I would say that a lot of it has to do with borrowing for a poor-investment return education. Shitty college, shitty major, failing out, etc.
Combined with the pressure to go to college.
1 Like
I can personally relate somewhat to this.
My grandparents and parents were farmers who struggled to get by on small family farms. My parents were smart folks but only had grade 8 education as there were obstacles for farm kids to go to high school in town in those days.
However I had free busing to go to an excellent public high school in town. My parents couldn’t contribute significantly to my university costs but those costs were low then and I got by on grants, scholarships and a small loan. I was able to go to one of the best universities in Canada as all universities charged basically the same tuition: no “state” versus “private” university system.
So a low-cost quality education made the difference for me.
2 Likes
That chart is pretty good.
Brazil has astonishingly high levels of inequality and lack of social mobility.
While lack of opportunity (education) is a big driver of this, the other problem is that the “bubbles” of success are very small there. A person from a lower socio-economic class (even if they had become succesful over time) would simply not be accepted into the higher income “world” of society, which would then limit their advancement (as well as their kids).
Brazil is a special case though. I have never seen the kind of elitism practiced there anywhere else I have been to (US, Canada, and Europe included).
1 Like
Yes, scarcity and competition. There are enough people willing to work 40 hrs a week that people working less will have to give stuff up to do so. This makes a living wage computation tough. If you base a living wage on family head count and pay regardless of how many earners there are, the same size family with two workers will earn twice as much income as the single earner family. That drives up the price of things both kinds of families need.
1 Like