Something something irrational solvent.
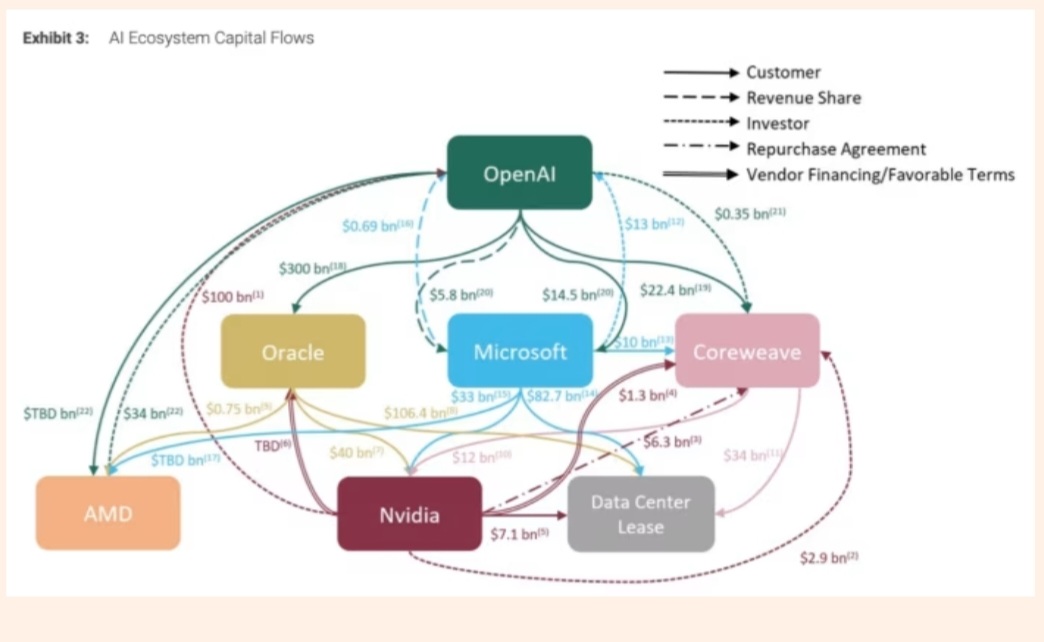
ITLR, it seems like musical chairs right now until someone gets paid for all this AI stuff, and a lot of folks are gonna be insolvent.
Something something irrational solvent.
ITLR, it seems like musical chairs right now until someone gets paid for all this AI stuff, and a lot of folks are gonna be insolvent.
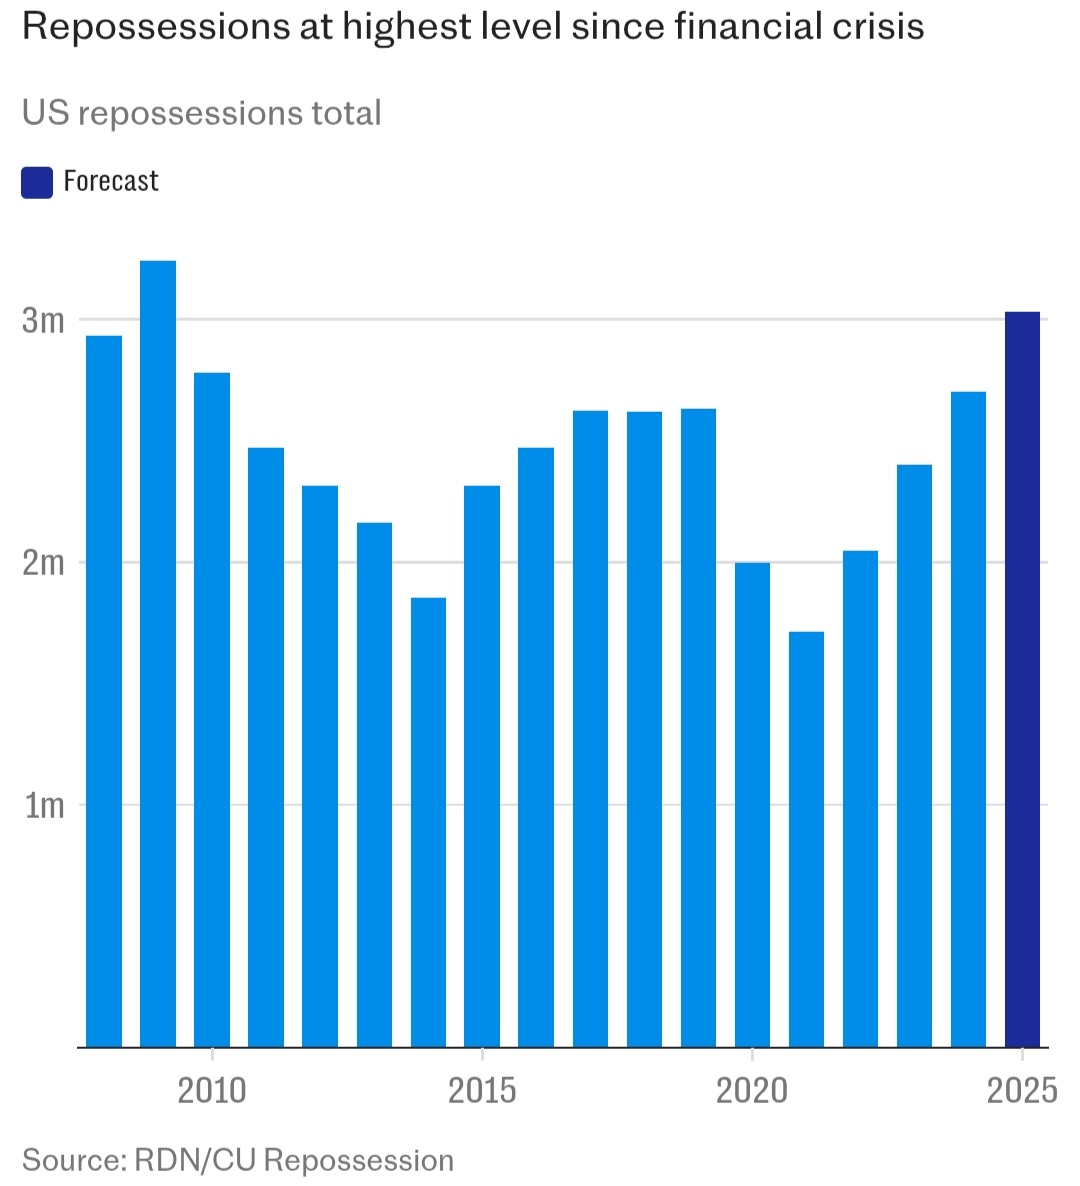
Yeah, but why? It’s a 5 year trend. So people had extra cash after COVID and overspent on a car, and they have been gradually running out of cash? Inflation and job losses may be on the horizon but haven’t happened yet. Cars are worth more now so banks are going harder after repos? Note: the US population has grown ~12% since the GFC so account for that.
No doubt there are economic headwinds and we are likely going into a recession, just don’t think this screams GFC 2.0 or anything.
Graph vs car sales would be interesting.
Surprisingly shitty graph. At a minimum convert it to per capita to account for changes in population size over time. Better would be to make it per capita car owners to account for shifts in both car ownership rates and population size.
Skyrocketing car prices could be a part.
I think the criticisms are valid (I’d really like to see repos per number of car loans outstanding), but I will observe: I suspect the US’s population has recently started to decline.
Also, why did they drop in 2020 and 2021? Important reminder - there was a labor shortage from COVID and being a repo man is probably not very high on anyone’s list of jobs they are going after (sounds dangerous). So there is almost certainly a backlog in the metric that is getting caught up now that the supply/demand for labor has become more balanced.
I doubt seriously that ee availability had anything to do with repo numbers. More likely lack of car sales, emergency $s being used to pay loans.
Why not a bit of AB&C?
You’d think they’d give them a month
I should probably clarify, that I think repos are going up. I’m just doubtful about the comparison of where we’re at relative to 2008 given the lack of adjustment for population changes since then.
From what I could gather, population growth since 2008 is around 11-12% (never above 1% annually), which would put the 2025 column a smidgeon below the 2010 column.
Swapped my SCHD for SPHD in my brokerage. I saw I had some ST gains that I took earlier this year and my SCHD was down enough to offset that (also a ST loss). SPHD should be a bit more defensive. Guess I need to start paying more attention to this tax stuff.
Maybe… Gold and silver are jumping again. Up 2 and 5% today respectively.
My international stuff is chugging along nicely: VEU, VYMI, LVHI, VWOB… Gold is only 7.5% of my portfolio now.
I would imagine its some movement from the shutdown news. Nothing else has changed economically speaking.
A very interesting assumption regarding one of the drivers of gold demand this year.
Looks like China has been buying large quantities of gold in order to diversify away from US treasuries exposure.
Buy AMD?