Tl;dr: how do I determine which local candidates are similar based on their results from 10 precincts. Is Correlation good enough, or is there something better?
I’m involved in my local town politics. The elections are non-partisan, but it looks like people are forming factions. I’d like to measure how much that is true.
My thought is that I can look at the correlation of the vote percentage by precinct for the “Liberal” candidate for schools and the “Liberal” candidate for zoning and the closer it is to 1, the more the perception is reality.
I realize that only 10 data points (from the 10 precincts) won’t tell you much statistically, but this is local politics, it’s really just for discussion.
I will be doing the cable access election night show (humblebrag) and want to be able to look at things like this as the results come in.
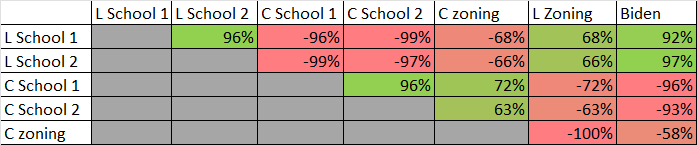
I’m looking at last year’s results and put together the charts below. In this chart I’m showing the four school candidates who ran for two spots, the 2 zoning people and Biden. I’m measuring the correlation of the percent of the vote.
Is Correlation the measure I want to be looking at?
a. What’s a good layman way of explaining eg 66% correlation? “They move together in general, but not totally”?
Do you have a better way of showing it than the chart below?
How many precincts do I need before I start showing correlations on election night? 3? 2?
Thanks. I’m a former pension actuary so I appreciate the stats knowledge from the real actuaries here.
And does N = 10 reflect all data collected? What exactly is N? Also, you’re assessing what percentage of who voted one way (or the opposite)?
As for laymen’s term for correlation: “An indication that if you know the value of one variable, you have a strong/weak/no probability of knowing what the value of the other would be.”
And I’d have the “L” grouped together and the C’s grouped together. As it is, you have C’s in the middle of the L’s.
And you might look for a more “local politician” (US Congresscritter; State Congresscritter; Gubner; etc.) to use as a “baseline”; and include a C-type person as well as an L-type person.
Because zoning was a 2 person race, since C zoning and Biden corelate -58%, L Zoning and Biden corelate +58%. (If I got that math wrong please tell me). I will probably include all cross tables like that one, even if they are not needed.
We have 10 precincts and I have the vote totals by precinct. So this is just looking at how the votes were distributed geographically around town.
In some races I’m looking at the percentage of the 2 person vote, for example for Biden I’m using a % of the total Biden Trump vote, not 3rd parties. For the school race - 4 people running for 2 spots - I’m looking at each person’s percentage as a part of the total of the 4.
I agree I should group the two camps together. On election night I’ll even say that I expect to see green squares over here and red squares over there.
Last year there was not a real perception that one zoning person was liberal and one was conservative… but this year there sure is. Part of this exercise is to test this year’s results to see if voters are splitting like that or not.
I’m probably going to use Biden/Trump as a baseline. I live in a part of the country where republicans don’t bother running for congress.
There’s another stats question - if Biden won my town 75/25 and I’m doing a correlation in a local race that ends up 55/45, is that a valid comparison?
I hope yours is not a jurisdiction where you have to distinguish between votes counted for Trump and the \textcolor{red}{\text{far higher}} votes cast for Trump
This latter issue is why I’m suggesting looking at something “closer to home”. I’m pretty sure that this last Presidential election was based just as much on “not him” as it was ideology. That is why looking at votes for state congress might be a better comparison–especially since those voting for local positions are also likely to vote for state positions; but there are many who would vote for President (and probably US Congress) but will ignore local office (especially during mid-term elections).
And on a related note: I’m one who will tend to vote more conservative for national elections but more liberal on local elections.
Okay. Are you doing the correlation by % vote or total vote? If by %, are each precinct about the “same weight” in terms of total votes cast?
I’m doing it by percent, and there are pretty significant differences in the number of votes cast, a factor of 2 in some cases.
Since my goal is not to predict a winner but to look for similarities among candidates, I wasn’t concerned about that, but I’m interested to hear where you go with this.
And for a baseline comparison, not only do we often not have a republican in the race, we are split between two US congressional districts, so a comparison would be tough.
You might look at individual percentages and see if there’s a pattern between total number of votes cast and the distribution between candidates.
I would also think that the percent of eligible voters would have good value toward interpreting other numbers. For example, within a precinct where only 25% of eligible voters cast a vote, 82% voted for {C|L} has a pretty different context than 82% of eligible voters casting a vote with the same distribution.
I’d imagine that “number of eligible voters” in a precinct wouldn’t be difficult to find; absent that, some reasonable proxy could be used as well. For example, replace “eligible voters” in the above paragraph with “residents” and you can draw other “interesting facts” (albeit different ones).
As for a more local politician, what does the governor’s race tend to look like in terms of candidates?
I can easily get the number of eligible voters. The town clerk publishes that, and of course I have an excel file with every eligible voter and their info. Can you say more about what you would do with that?
The Governor’s race is a good idea, I’ll take a look at that.
You can make a stronger conclusion about a precinct from its voting record if 80% of the voters voted than if only 25%.
Also, if only 25% voted, any conclusion will be tied to what that 25% represents (and less about the precinct as whole in terms of how it leans; at least directly); most likely that the precinct is apathetic toward civil duties?
You might also do an analysis of which voters turn out for each election over the last several election cycles (if that info is also available). For example, in that precinct with only 25% turn out:
Is this consistent across elections?
If so, is it the “same 25%” doing the voting? (Given recent election topics, could there be an element of voter suppression?)
Probably do a similar evaluation for the 80% turn out precincts, but look at:
the one’s NOT voting across election cycles.
If it’s not consistent, was there a “controversial” item up for a vote or something that garnered the higher turn out?
Yeah, I have files on all the registered voters and which elections they have voted in since 2015. I’ve used this to make lists of frequent voters to help candidates know who to target. It’s fun