meep
October 12, 2021, 6:23pm
1
Dmitry Kobak ,Sergey Shpilkin ,Maxim S. Pshenichnikov ,
First published: 29 September 2020
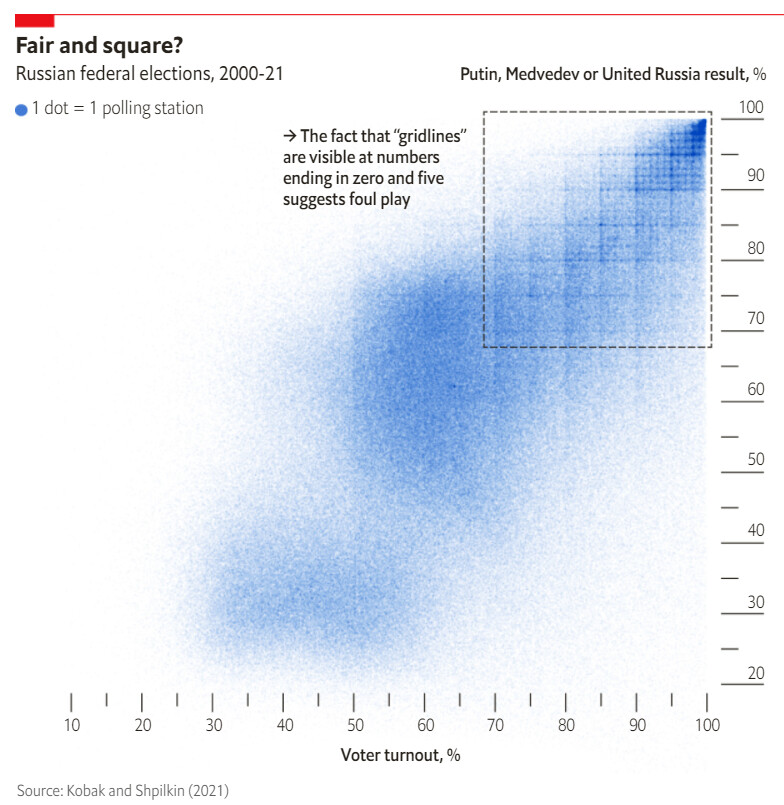
They’ve been researching this stuff for a while. I came across it due to a piece in The Economist:
Check out this nifty correlogram:
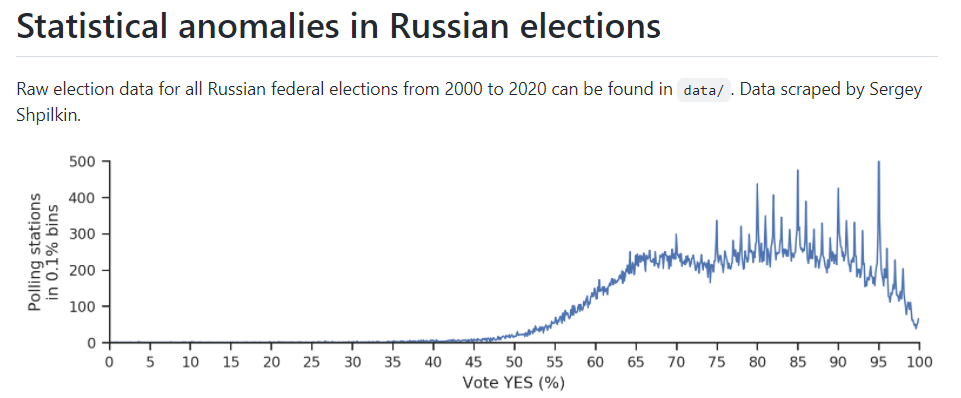
Then this distribution graph:
Nice spikes.
Now, I could come up with an alternative explanation – namely, laziness on the part of the election officials (just round off ballot counts, I guess). But it sounds like maybe they did have target percentage goals, but that they were spread out like that… no clue. That would take a lot of coordination, I assume. Would like to know where these polling stations are.
Maybe I’ll dip into the data later:
You’re repeating yourself with the thread title once you drop the parentheses.
In Soviet Russia, election frauds you!
meep
October 20, 2021, 1:55pm
4
Oh, I missed this aspect:
I assume that that made it more difficult for them to get the results in an analyzable form
meep:
Now, I could come up with an alternative explanation – namely, laziness on the part of the election officials (just round off ballot counts, I guess).
I didn’t look at the data, but I didn’t get the sense that the ballot counts were rounded, only the %'s.
lol my excel does not like russian.
Sum of ЧиÑло бюллетеней, выданных учаÑтникам голоÑованиÑ
…But yeah… looking at the data, the “coincidence” is that a whole lot of polling stations have something like: 1483 votes yes, 78 votes no = 95.003%.
And I don’t think it requires a lot of coordination, so much as one guy with an excel spreadsheet who is not very good at fudging data.