Actuary Fred Vettese in today’s Globe and Mail nicely captures in a graph the narrowing life expectancy between men and women. Widows are getting scarcer as a result.

1 Like
I’m sure MAID is “helping”, but also, Alzheimers is more a female phenomenon and has been increasing in the U.S.
I wonder if Canada has been seeing the same.
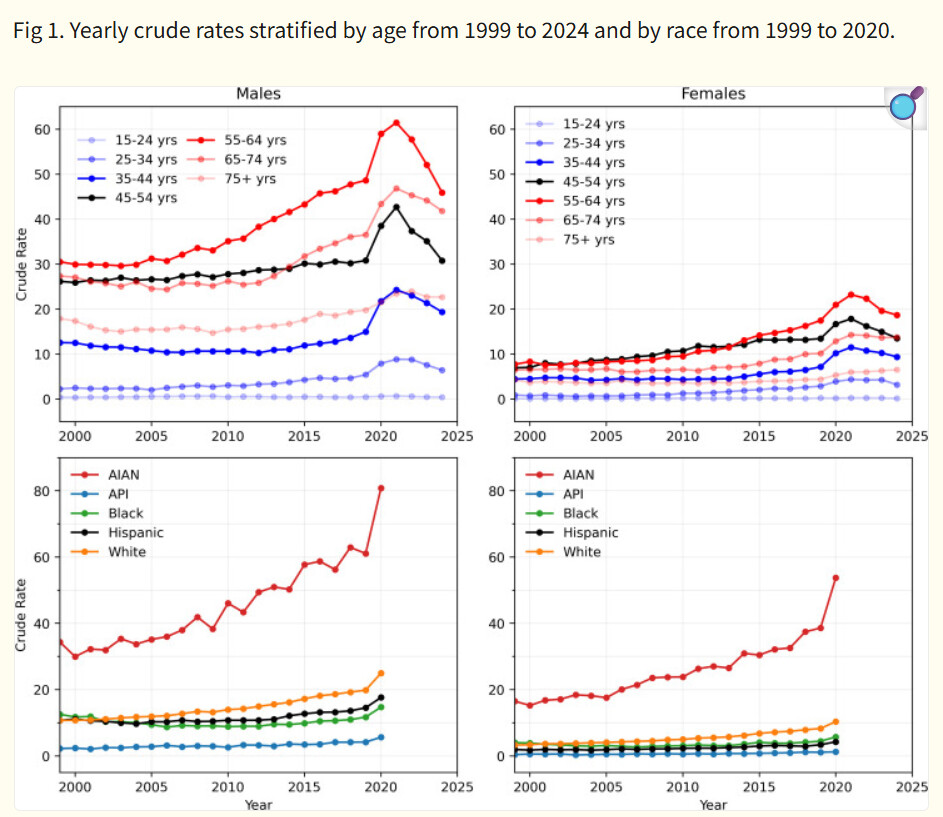
drug OD deaths:
data:
TIL 5,283 work-related U.S. deaths 2023; 30,000+ per year in the 1930s. This seems a remarkable improvement, especially considering the increased population. ![]()
and I wonder how many of the work-related deaths in 2023 were motor vehicle accidents
2 Likes


https://www.nature.com/articles/d41586-025-01969-1
(Yes, I’m linking because I’m quoted in the piece)
How actuarially useful is this?
Is that births today?
Is that an average of people of all age?
Is it using deaths only, like amateur actuaries/professional psychologists would?
(Don’t make me dig up (heh-heh) that shit study and the debunk by Panjer.)
OK, here is a summary of the debunking:
If anyone has the hard copy:
Trans Soc Actuaries. 1993;45:257–74.
LA TImes 1991:
La Times 1993, exactly two years later:
But epidemiologists, such as Dr. Jack M. Guralnik of the National Institute on Aging in Bethesda, Md., said that such studies show a “classic fallacy” in epidemiology by looking only at the age of death while not considering age-specific death rates and the percentage of left-handers in each age group.
“It’s like saying that riding a tricycle is more dangerous than sky-diving because the average age of toddlers killed in trike accidents is so much lower than that of sky-divers killed in accidents,” Satz said.
Oh, and this one:
“Let psychologists such as Drs. Halpern and Coren study the living and leave mortality analyses to actuaries,” said James J. Murphy, executive vice president of the American Academy of Actuaries.
Well, here is one relevant piece of info, and think why you don’t get to use it:
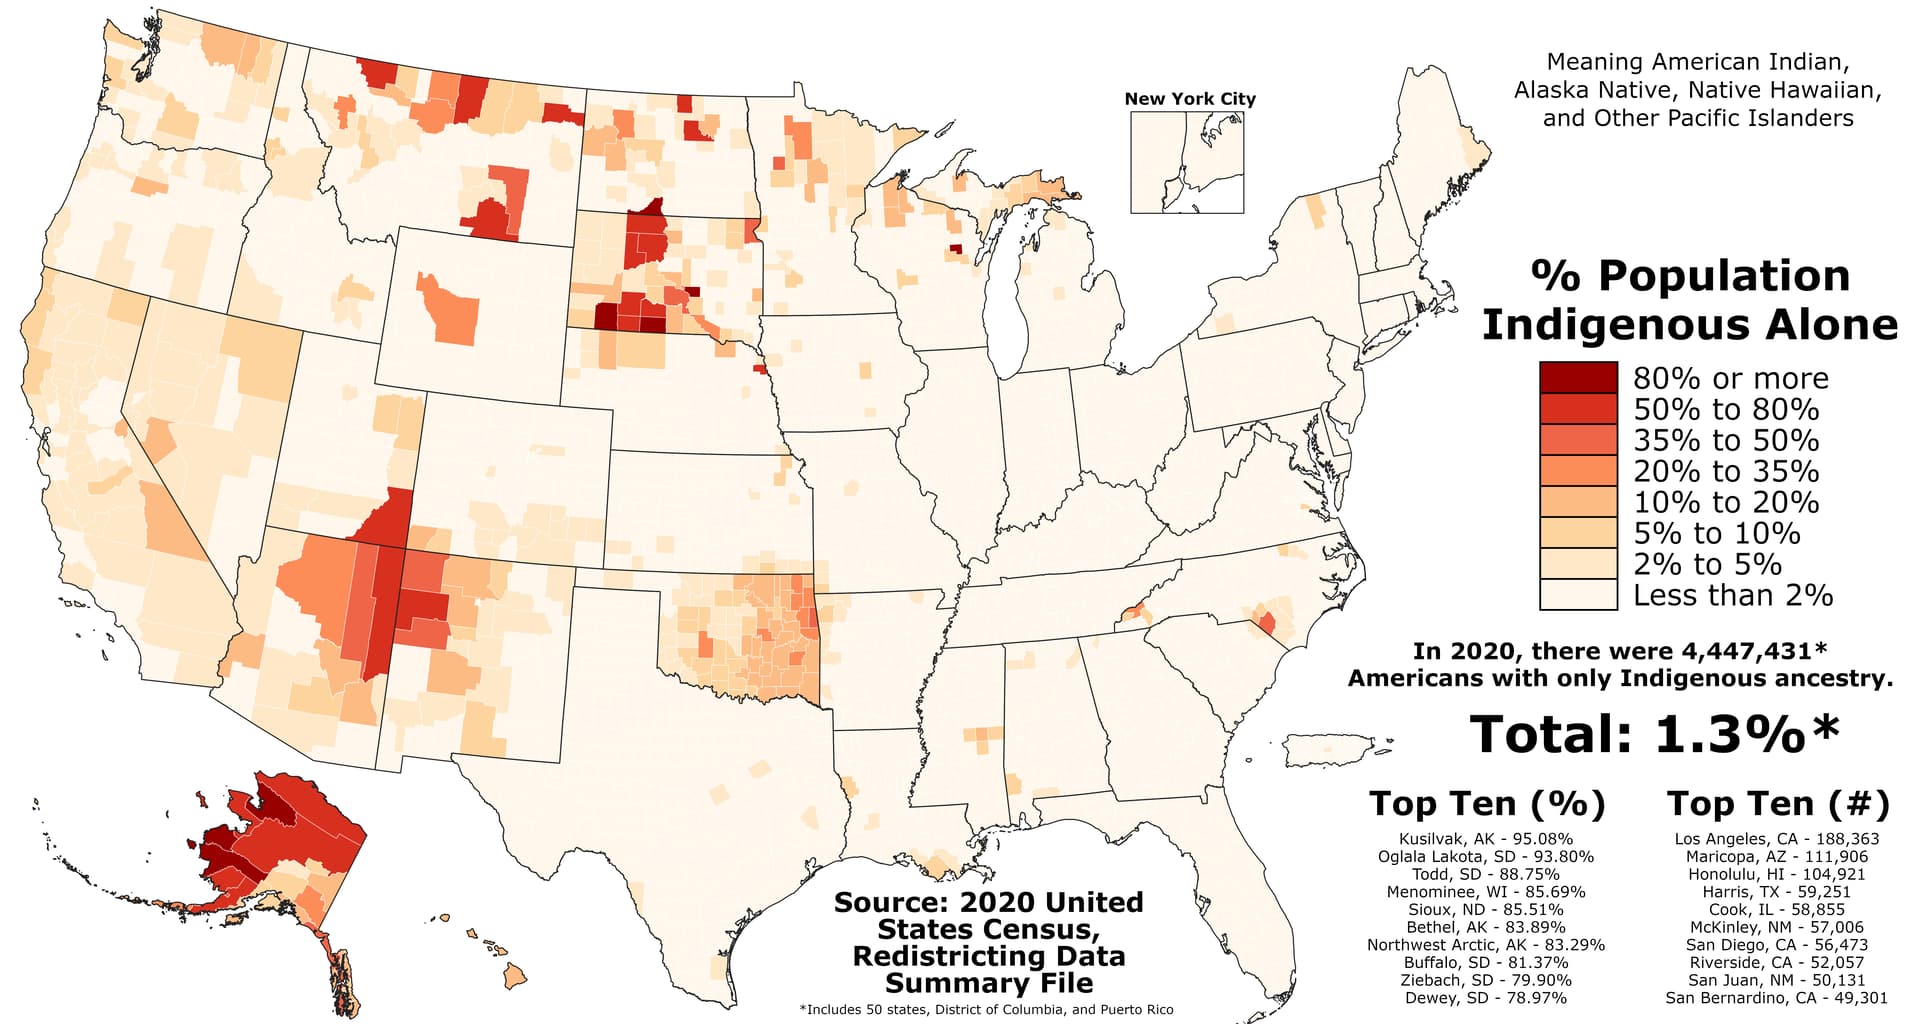
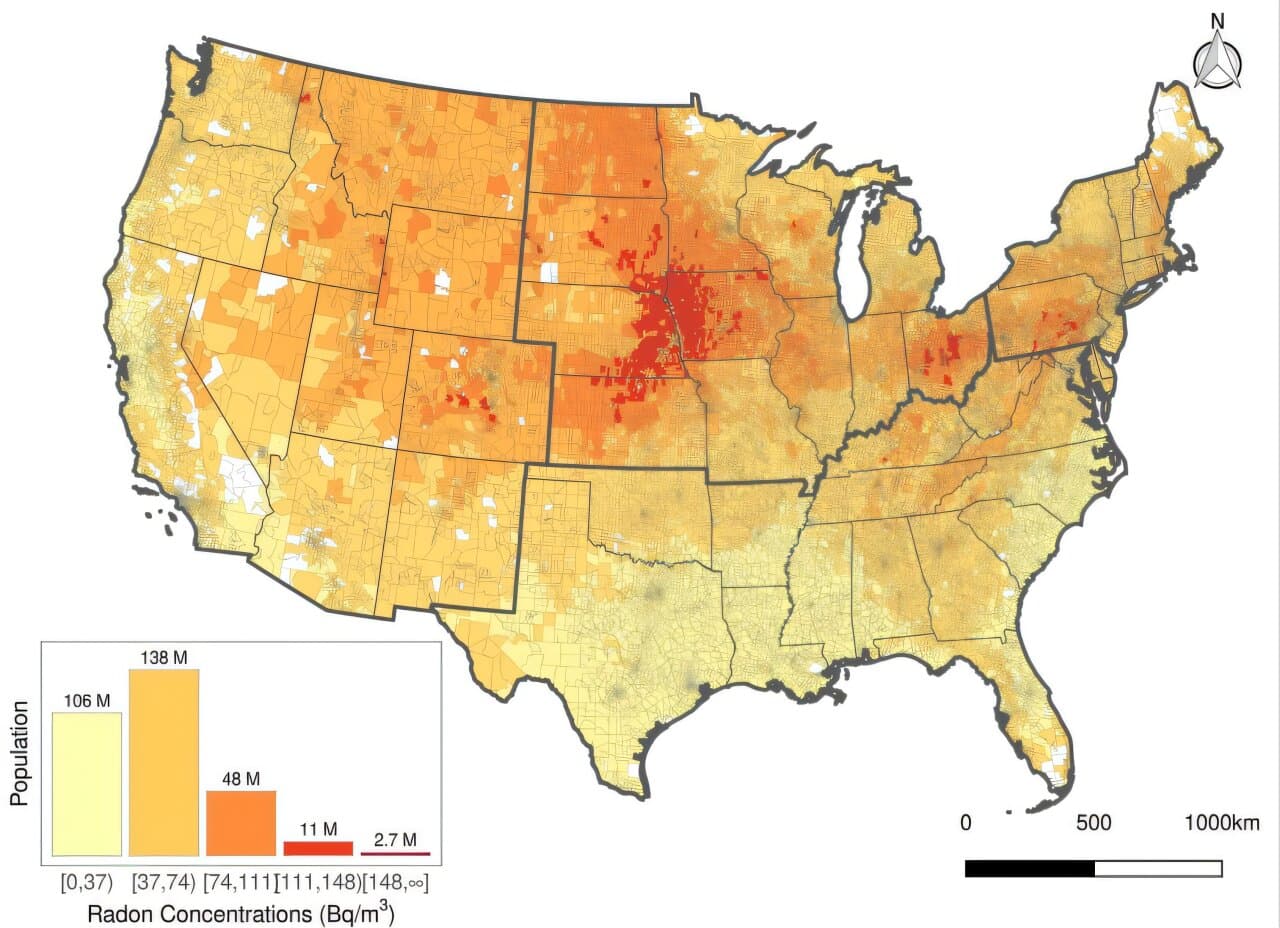
When I do racial break outs by specific causes of death, for AIAN (American Indian/Alaskan Native) there are a whole bunch of CoDs where the rates are a lot higher compared to other groups: suicide, alcohol-related deaths, drug ODs - and these have an outsized effect at younger ages (guess what that does for period life expectancy?)
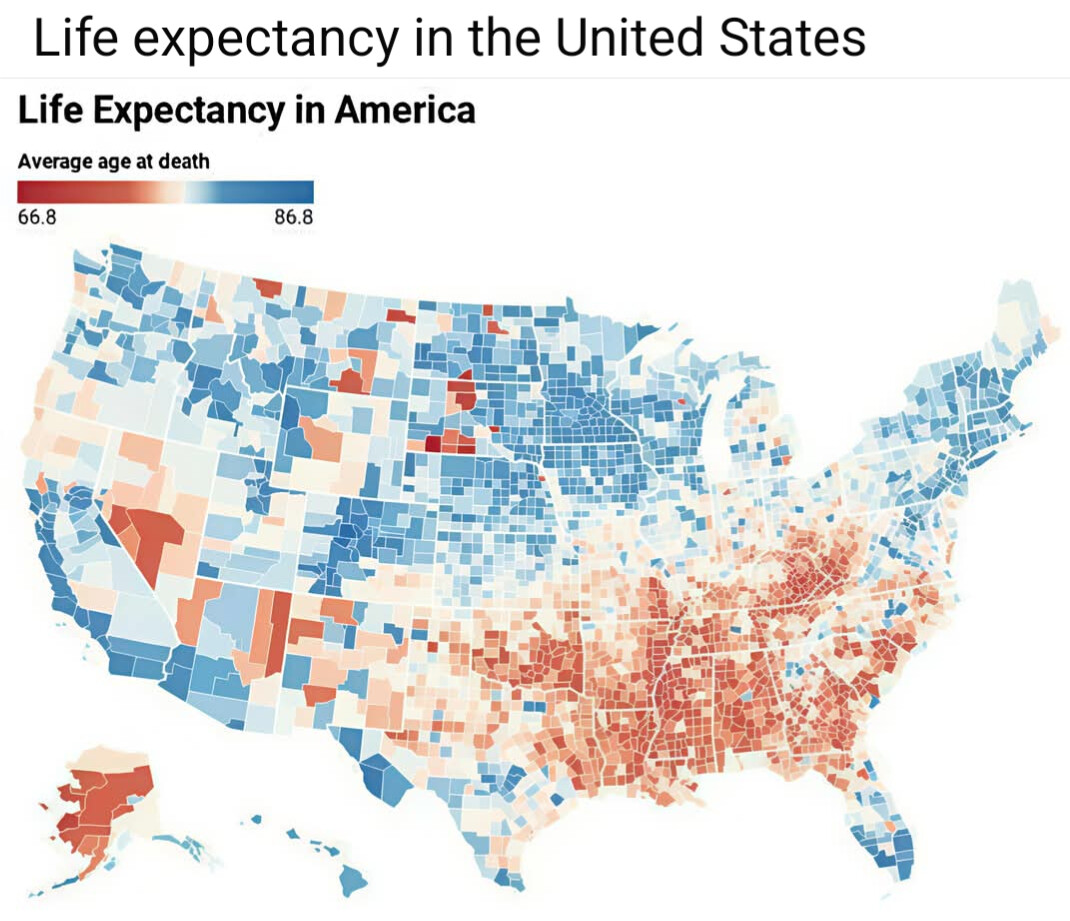
People are familiar with the racial concentration of the southeast, perhaps, but not as familiar with what’s going on out west.
To be sure, one can underwrite for alcohol/drug use, and other things that would be related, and that would likely capture all this.
Has there been any shift in how alcohol use has been underwritten over the years? Medical associations have been scaling back safe levels for the past 20 years and the WHO is now suggesting there is no safe level of alcohol consumption.
Yeah, I think the “no safe level for the liver, heart disease etc.” is well-attested
There’s confounding effects for earlier studies where tee-totalers had bad mortality.
It wasn’t just a situation of ex-alcoholics, but that there was a cultural aspect in terms of what types of people were in the no-alcohol-ever groups. Tended to be in certain religious groups that also were more likely to be obese/diabetic, etc.
But also that alcohol consumption at a non-zero level was correlated with higher sociability (in many cultures where booze is a large component)… and social exclusion is bad re: mortality.
Lots of interacting effects.
1 Like
Redlining was my immediate reaction.
I’d love to go back to school to build out a system to take insurance data and check it for redlining. I bet its happening now, but people are ignoring or ignorant of it.
1 Like
Yes, they are probably checking for people who are bad credit risks.
1 Like