That was my thought. Drowning and car accidents and cancer all kill kids. Other accidents and homicide and among teens also suicide. Preemies and newborns are susceptible to other stuff like heart & lung issues.
Influenza probably at all ages.
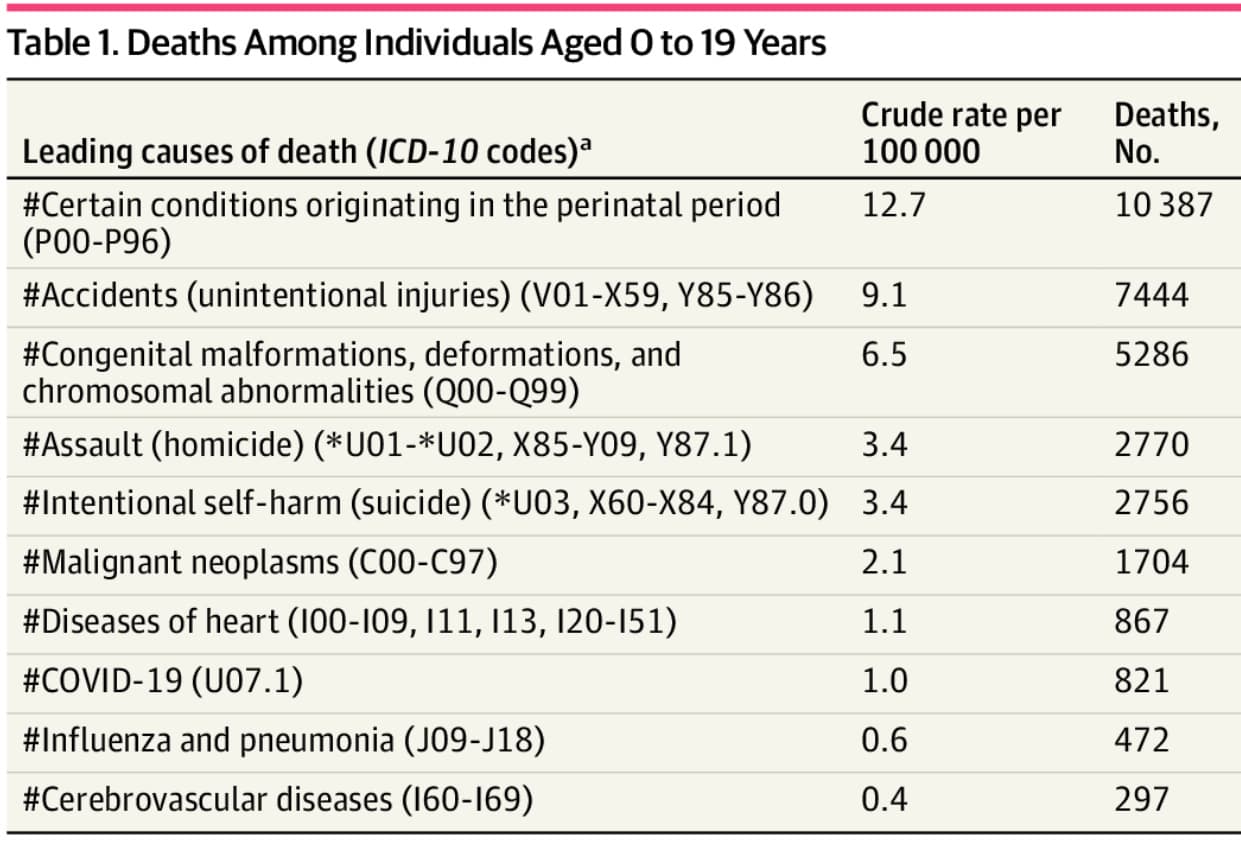
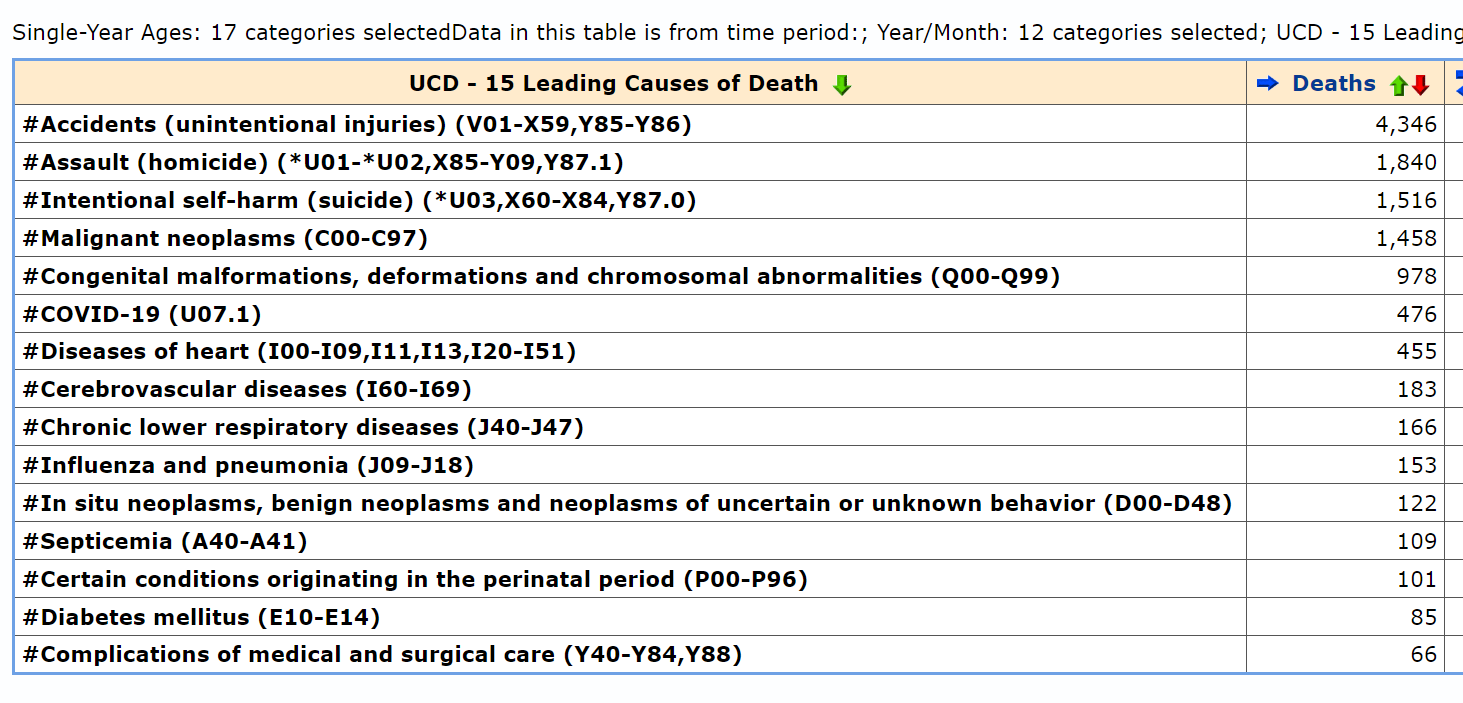
But… what else? It seems reasonable to think that Covid is in the top 10 list of kid-killers, which is why I’m curious to read why MPC says this is bullshit. I’m not doubting her… just that I wouldn’t have thought to doubt that particular stat since it seems quite plausible to me.
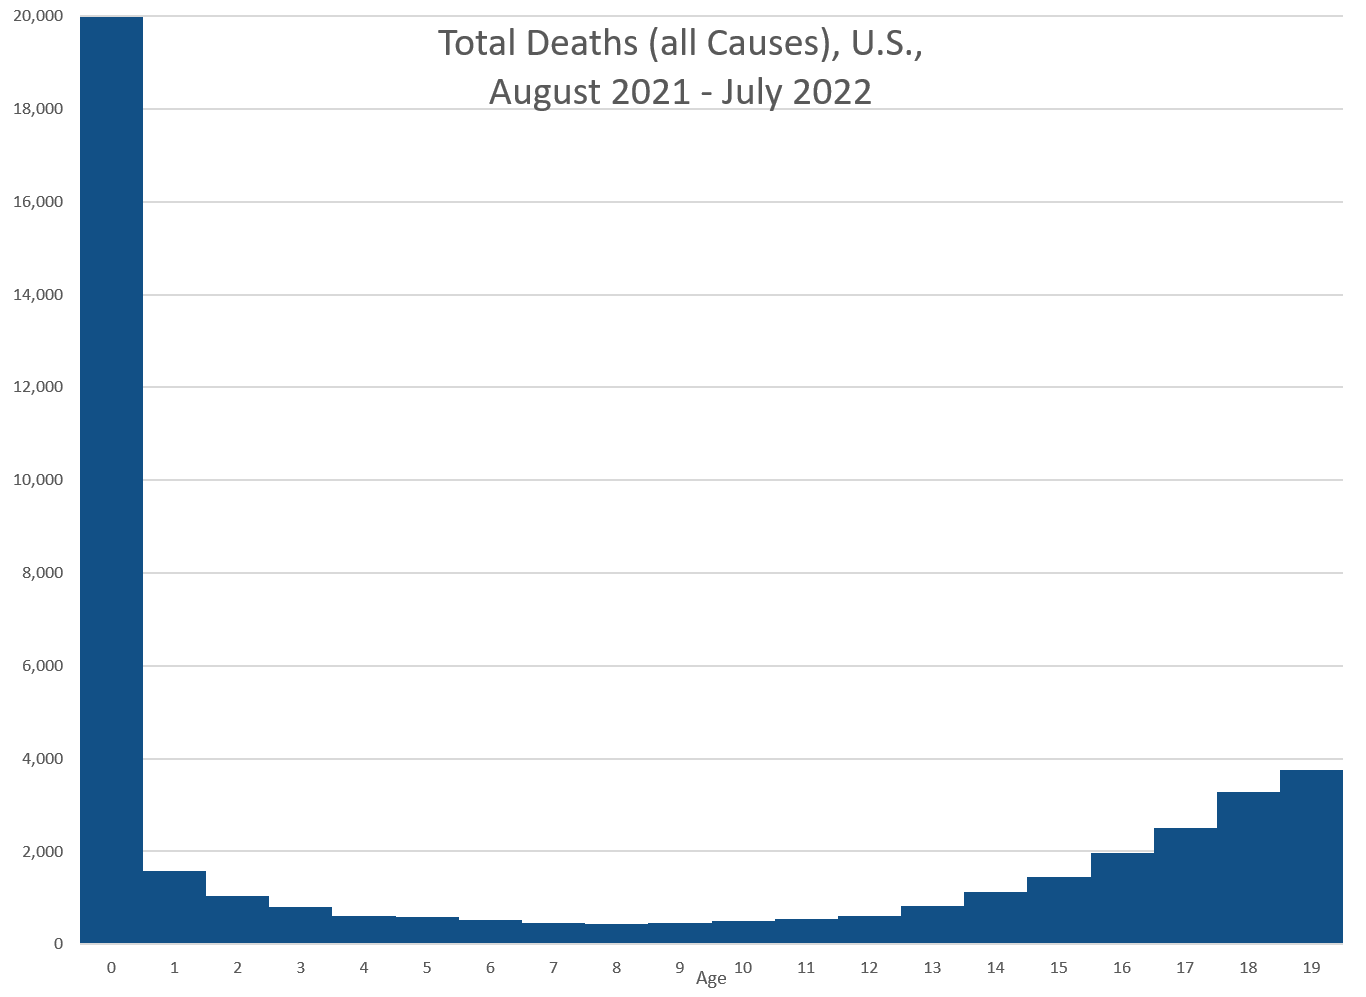
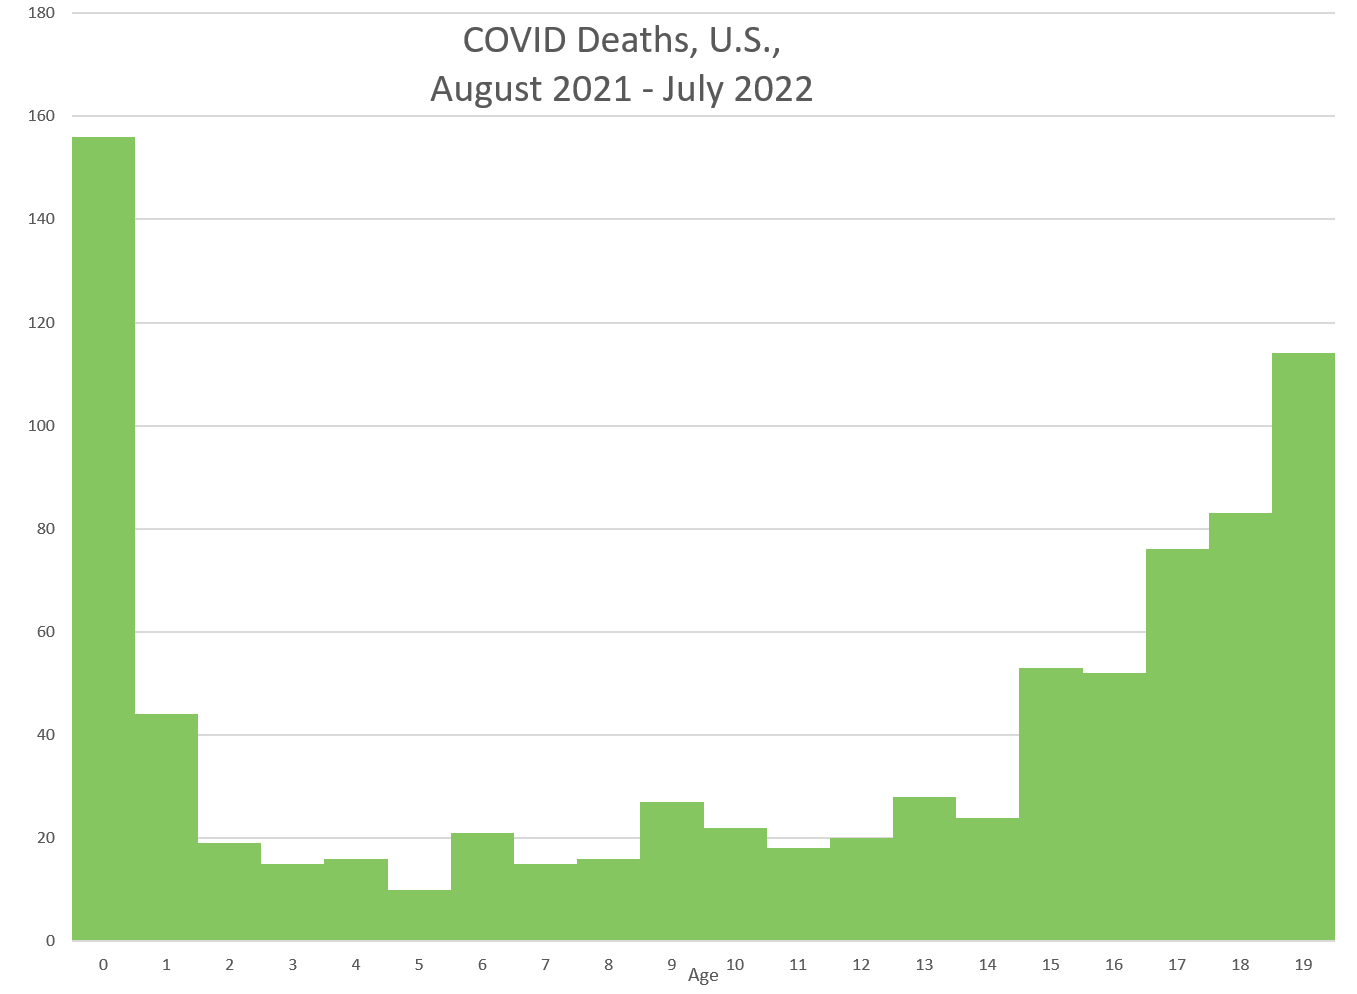
There is no good reason to throw in infants nor young adults in with children. The mortality profile is very different in terms of rate and cause, which was true pre-pandemic and during the pandemic.
So why did they do this? It’s so they can get a COVID death number somewhat close to 1000… for the worst COVID death period they can cherry-pick. And they get cause #8 in ranking.
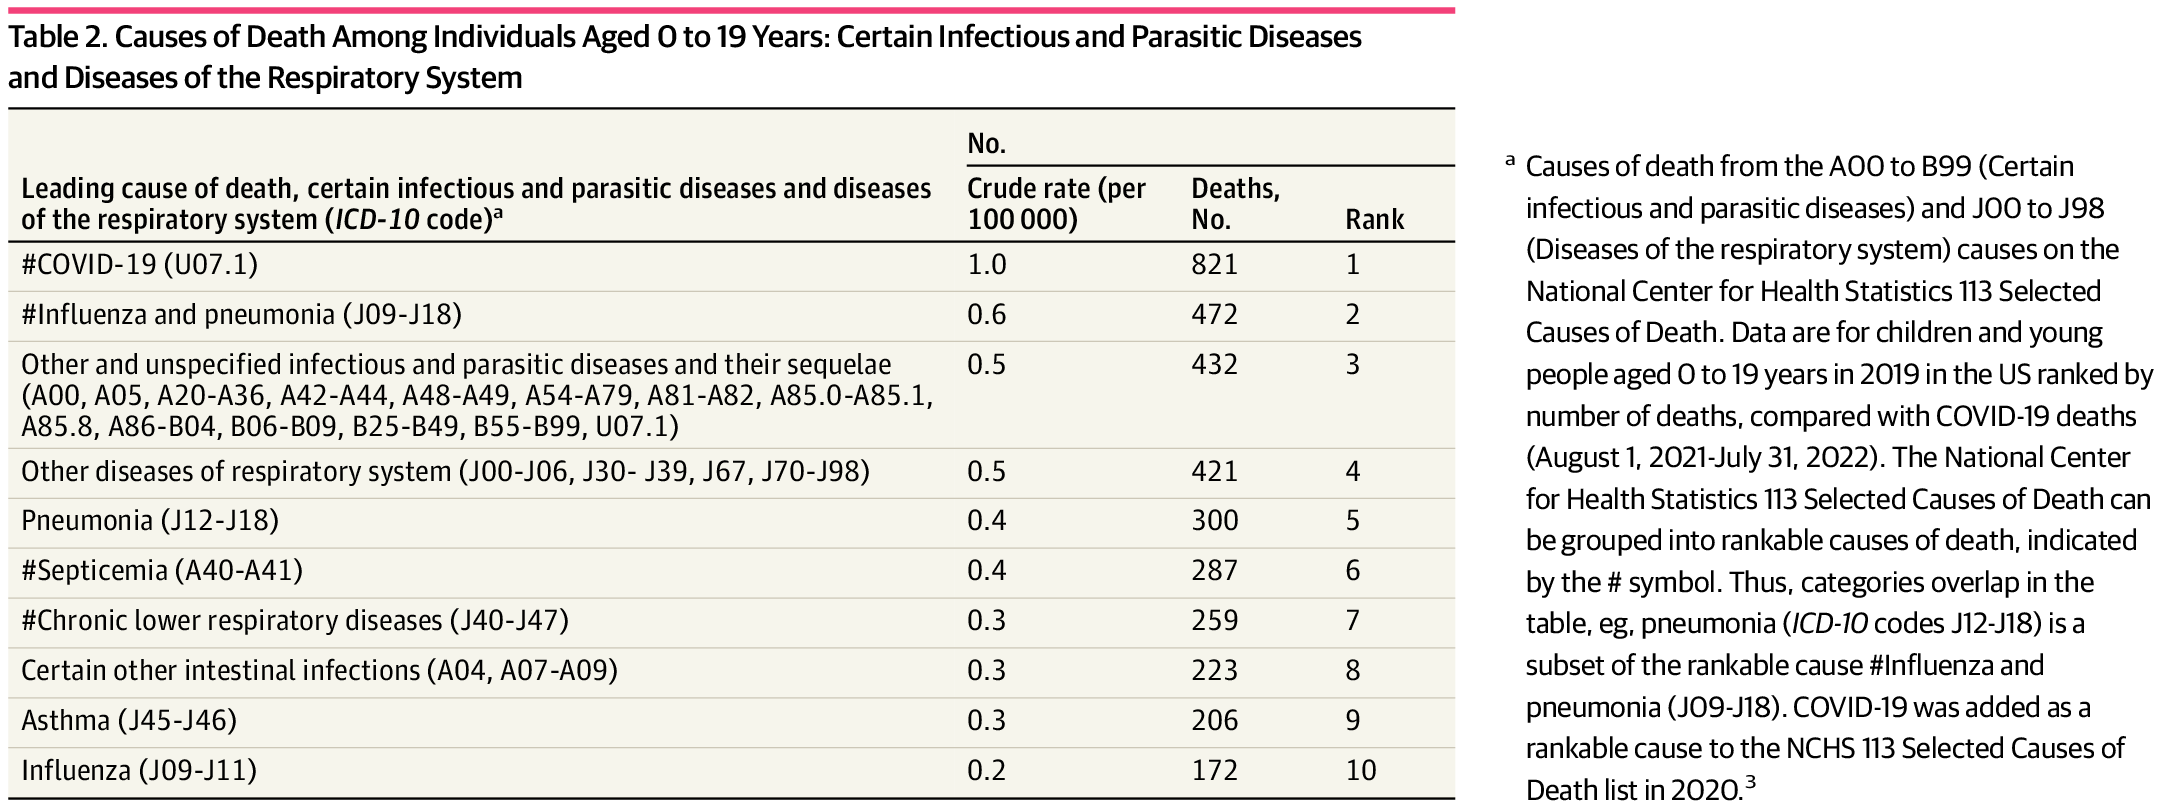
This is the ranking (and count) for the same period, just age 1-17:
If the earlier choices weren’t obvious enough, this is the point at which you should have seen they were going to keep cherry-picking in order to make COVID come out on top, somehow. I didn’t even bother with that part.
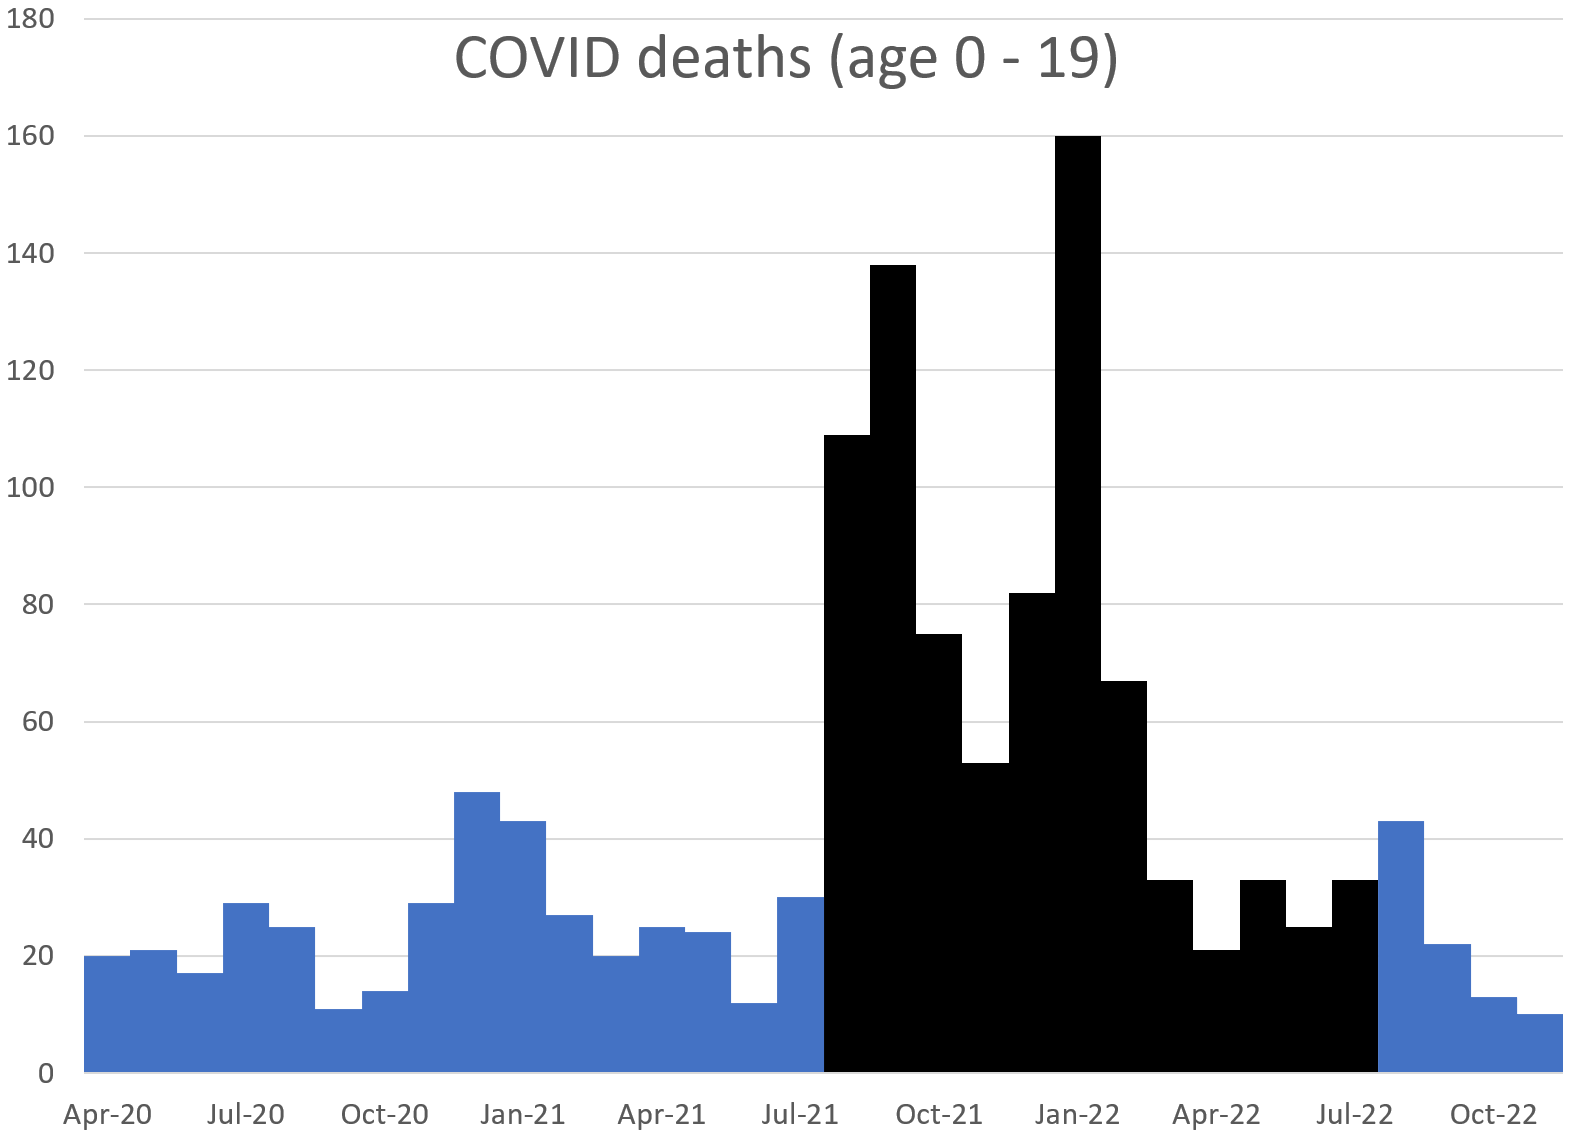
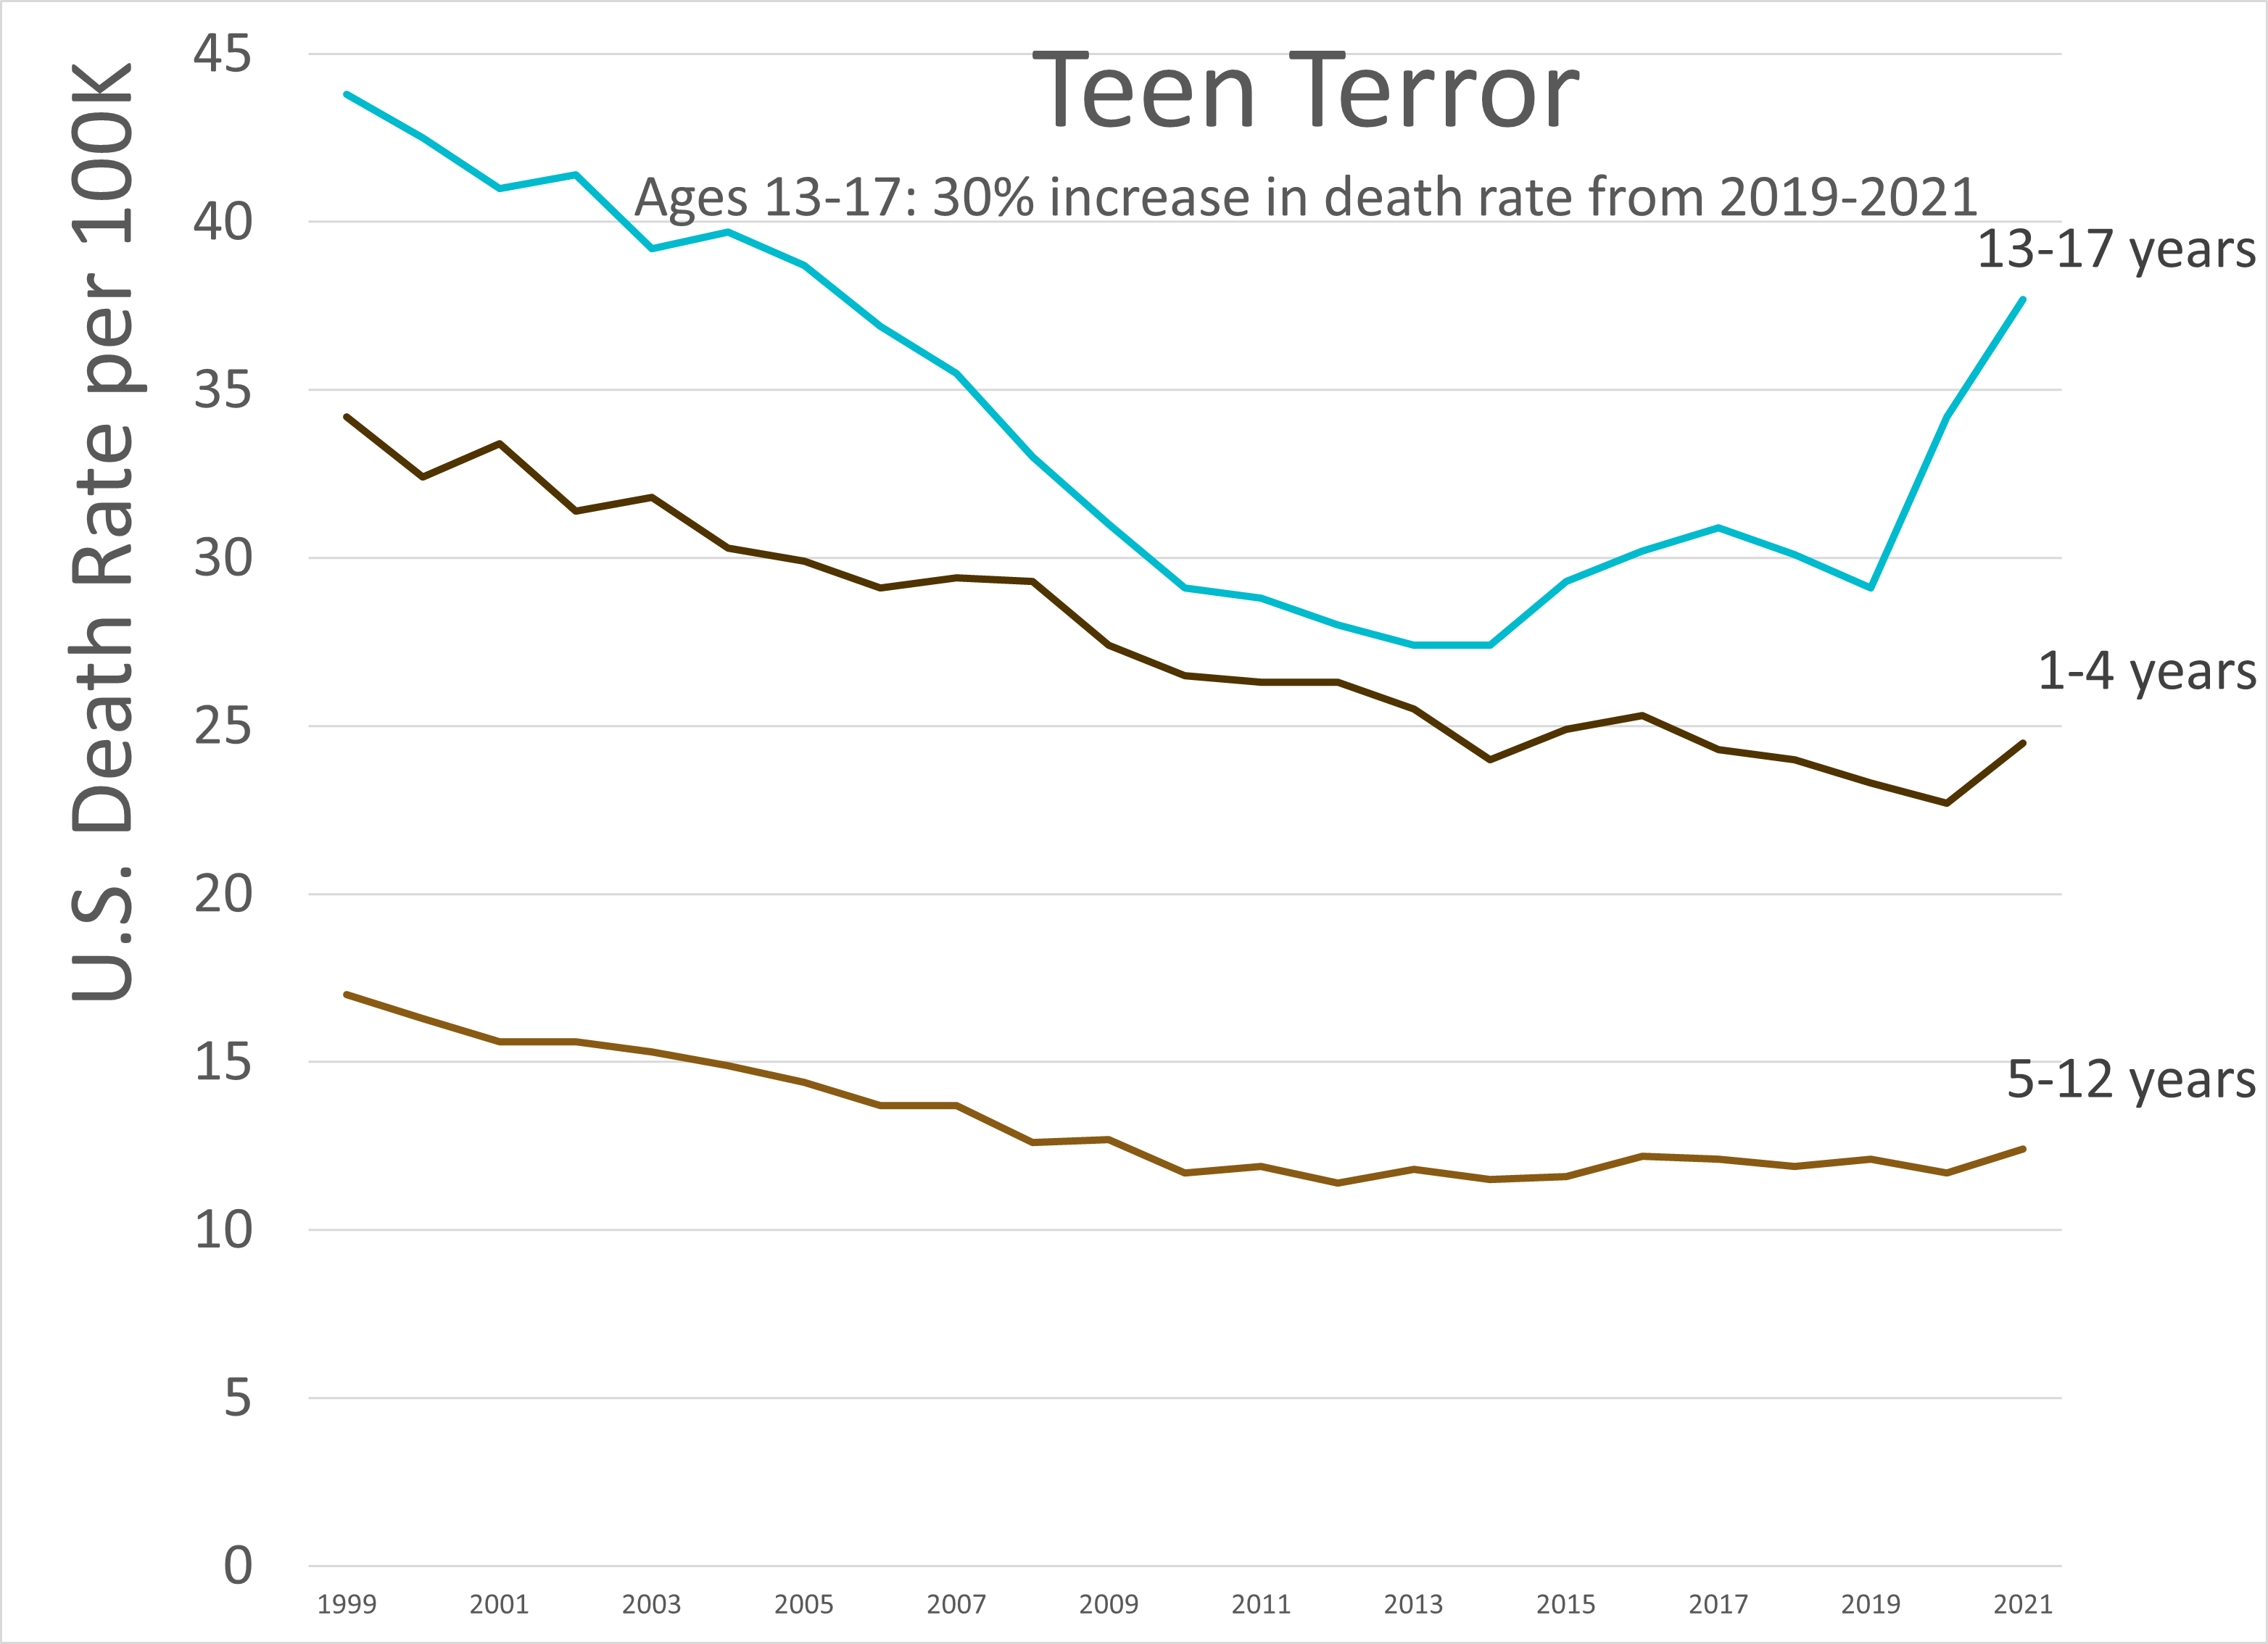
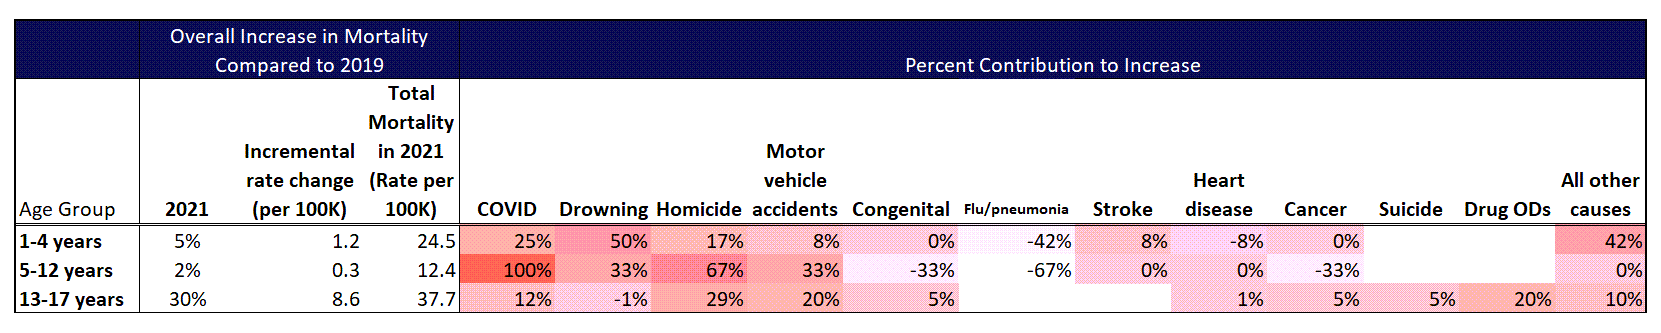
The issue I have is that mortality for teenagers at least did go up a lot during this period. And it was barely due to COVID. For little kids, it barely moved.
So if one were concerned about mortality increases among children, I might look to the increases in deaths due to homicide, motor vehicle accidents, and drug ODs among teens.
Yeah, I got so annoyed, I think I’m going to make my podcast episode about this [instead about the taxes stuff I had already recorded, and I can push it off til later]
In any case, I do need to do a refresh of the posts I did last year by age group & cause of death, but I may wait til the February database update [because of the 6-month censorship of external causes of death]
What to make of the excess deaths reported on Our World In Data (I was looking at the line charts), mainly latter half of 2022, for countries around the world (compared to 2015-2019 averages)? Australia, Germany, Austria, Netherlands, France, UK, Ireland, Sweden, USA, Japan, etc.
Are these early warning signals that warrant concern? Should there be a sense of urgency in understanding the causes for an effect seen across countries and geographical regions?
(Country picker on the side, metric selection drop down box at the top)
and I heard about UK & others. I’m not assuming it’s all necessarily COVID. But it could be related.
As for a sense of urgency, it would kind of require knowing what is actually going on. Just running around yelling URGENT! URGENT! is not going to be helpful.
It may not be the same causes in all countries – and it probably isn’t. In the U.S., we had a huge increase in homicides, fentanyl ODs, and motor vehicle accident deaths, among other increases in deaths. I don’t think that is necessarily the case in other countries. The magnitudes differ (as do the patterns).
I think it odd that they don’t have Canada data past August.
“require knowing what is actually going on” is the question, isn’t it? Double digit percentage increases in some countries over historical average might prompt a reaction leaders like “This looks bad. We should try to understand this asap in case there’s something we can do about it. That’s a lot of extra deaths.”
Obviously a chicken little response isn’t helpful.
A similar effect showing up at about the same time across countries and hemispheres is a curious thing. Multiple things going on of course - Covid disease, lockdowns, medical interventions, etc.
We have the “dry tinder” effect where the most vulnerable early in the pandemic are gone now, but more people enter that class all the time as they get older, fatter, etc. The disease itself has become somewhat less severe over time. Most/many have gotten the disease, recovered, and have some level of protection. Large percentages of the population have been vaccinated against the disease, but booster uptake is very low compared to the initial rollout. Oral treatments are available.
It’s a complex situation.
Yes, it’s curious that Canada quit providing the data.
The UK used to provided death info by vaccination status every couple of months, but it’s been about 8 months since the last update. Outside statisticians pointed out problems with how the UK Office of National Statistics was treating the data. The ONS agreed with the criticisms but hasn’t yet corrected prior reports or issued any updates.
There are still around 400 death a day attributed to COVID.
I think opioid deaths are adding another 100+ a day over the baseline time period.
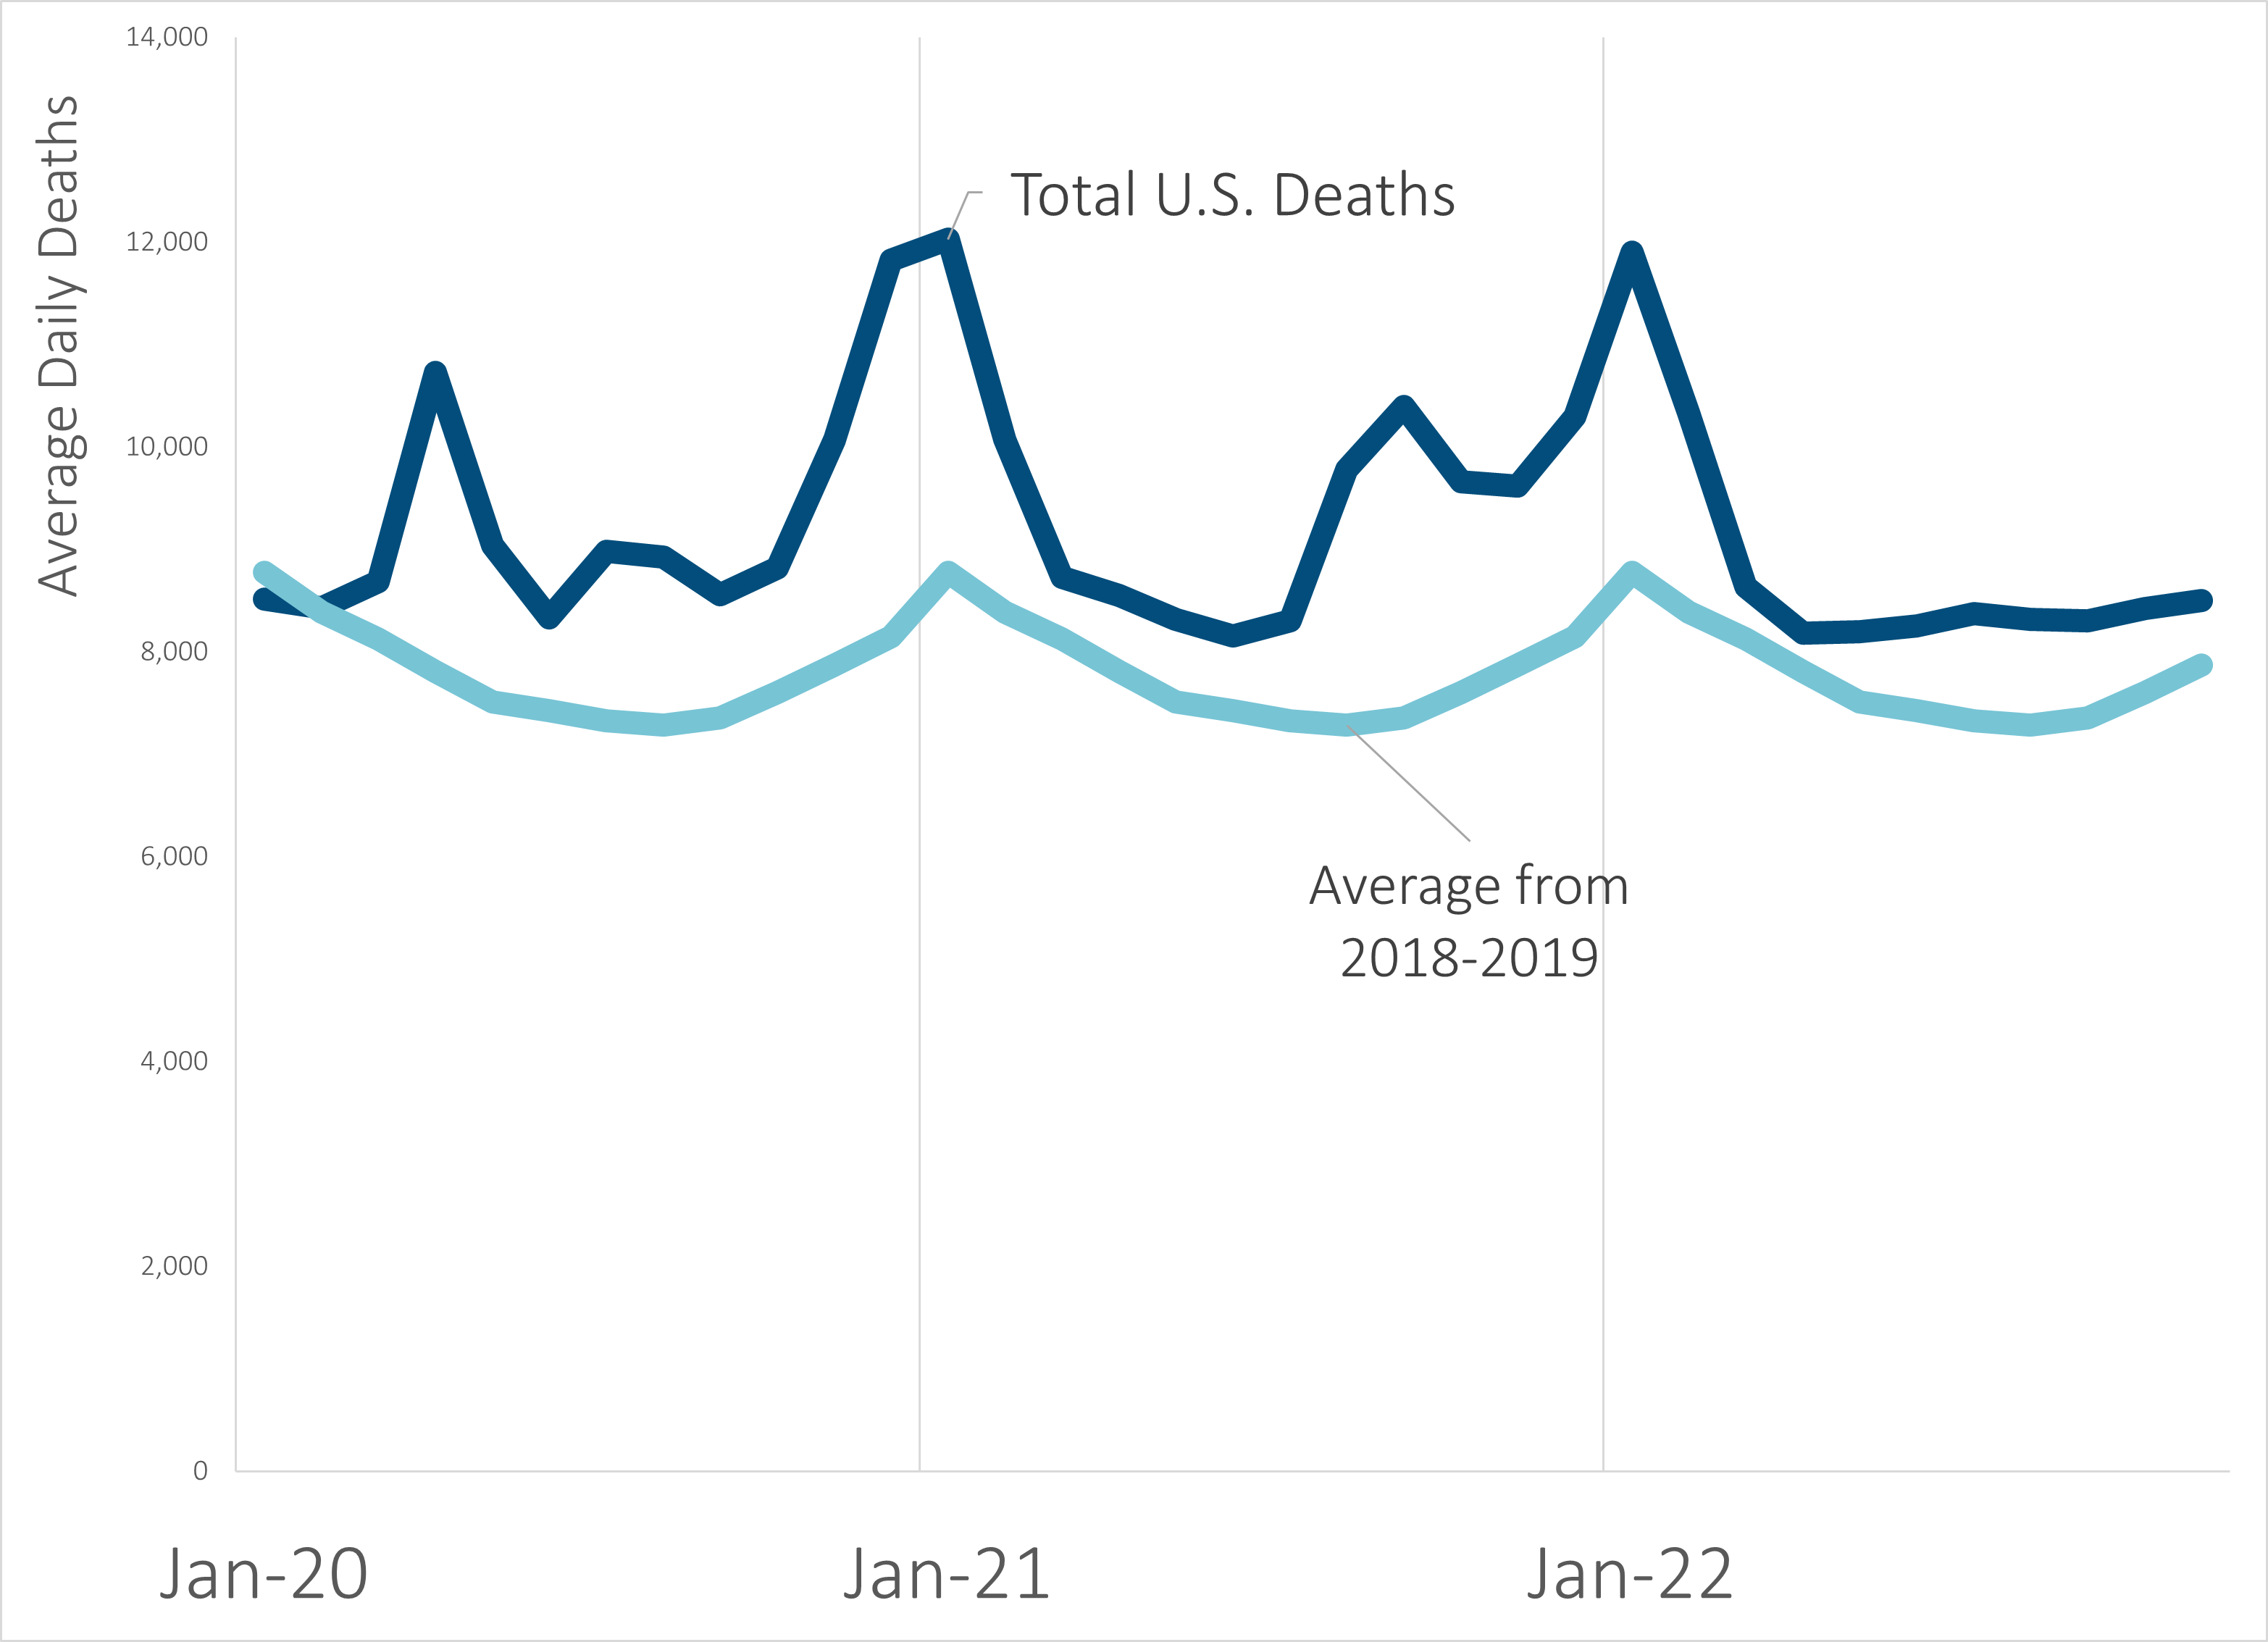
Might not be the entire excess, but 18-19 baseline should also need an upward adjustment due to the aging US population. That feels like the difference is mostly explained.
The 400 daily deaths due to COVID is a longer term concern as COVID is not going away. I’d think almost everyone would have caught it by now or been vaccinated, but say 10% of the US population may have no protection and that is still a lot of people.
Here’s UK data that breaks out Covid v non-Covid excess deaths. Lots of options to slice the data on the left (age, sex, region, etc.). The age band info is interesting. Covid deaths are the minority of excess deaths starting somewhere around mid 2022 for those under 65…
Official govt data, not sure how clean the data is.
A friend from London mentioned to me around that time that they had basically stopped testing. That seems to be confirmed by the published testing data.
I expect we will do something similar in May when the health emergency is supposed to end. If public policy is not in any way going to change based on infection or death rates from COVID, there is no point in the government collecting data on it.