Huh. That is not what I thought “Brexit” meant.
UK Nationals with only a British passport often had Irish links but never sought the Irish passport because there is free movement between Ireland and UK (CTA = Common Travel Area). But with Brexit, the British passport didn’t give them entry into the EU, so they went down the Irish passport route for EU access.
At this rate, Labour are going to be voted out of office for the next 20 years in 2029, as this has been completely self-inflicted.
NZ still popular with the rich.
IFYP
Considering the Conservative Party ran the country into an ice berg on purpose for 15+ years and should also be voted out for the next 20 years, who does that leave who should be in power for the next 20 years?
Thats the problem.
The duopoly that the UK has had over the last 30Y (Labour/Conservative) has now likely been damaged beyond repair.
So we are likely to see a fragmentation of the political landscape into liberal and conservartive parties.
Labour (20%)/Greens (20%)/Liberal Democrats (12%)
Vs
Conservatives (18%)/Reform(30%)
And none of them will get an outright majority, which means either forming a coalition or leading a minority government.
In short….its likely going to be a mess.
Honestly the US could use some fragmentation. But the 1st across the line method of our elections makes that highly unlikely.
Both the Democrats and Republicans have become controlled to much too great an extent by the extreme wings of the parties. Breakups might allow for a centrist coalition to form.
1 Like
That’s really been a myth that Fox News and others have perpetuated. The Democrats haven’t changed much over the last 30 years, the Republicans have moved pretty far right. And the leaders in the Democratic party are still pretty much beholden to big business.
4 Likes
The 30 year horizon is a tricky one, when it comes to changes among the D’s.
If you had said 20 years, I would agree with you.
If you had said 40 or 50 years, I would disagree with you.
Regardless, the R’s have moved further right than the D’s have drifted left.
The parties are more than the federal House of Representatives.
I was living in the rural south in the mid '90s.
For the 1994 primaries, I voted a bit after 5pm, when I cast the second ballot in my precinct in the GOP primary. (The election judges had to call for help to be reminded how to configure the voting machine for GOP voting.)
Today, I suspect things would be quite different. Last time I passed through the area, I saw more Trump flags than American flags.
Sure regions of America have also shown pretty drastic bifurcation in the 2 major parties. Rural areas have becoming overwhelmingly Republican and Urban areas have become overwhelmingly Democratic. That has pretty much left Suburbs as the battle ground. I guess we’ll see if that continues going forward as the Republicans are increasing shifting to becoming the MAGA party.
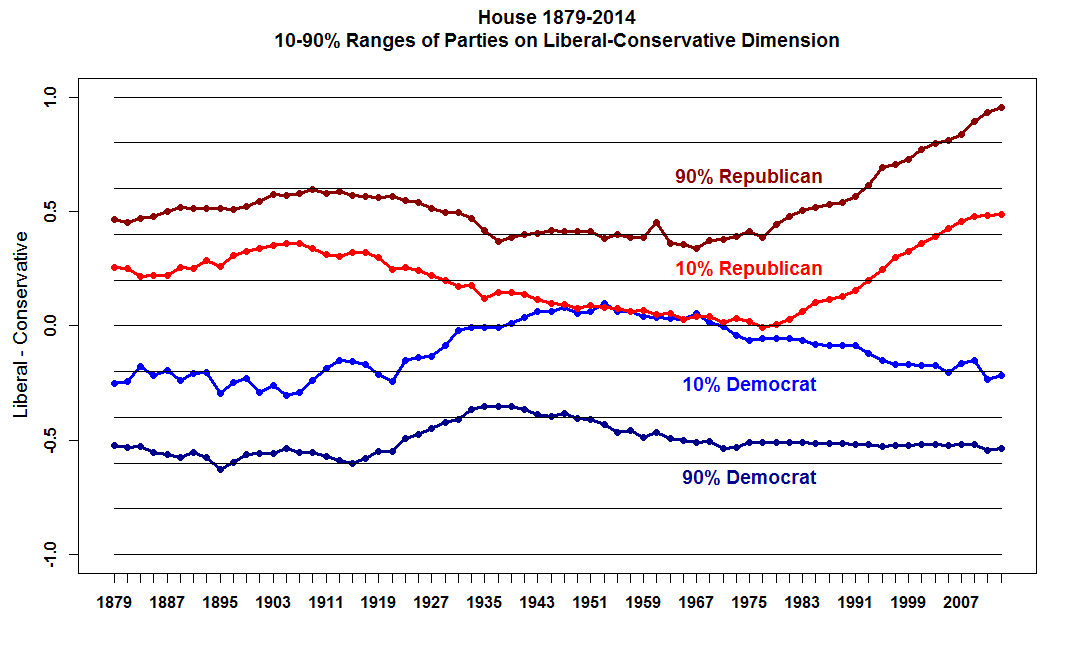
Source? I’m afraid that a lot of these types of charts are badly biased by source. No definition of dimension here.
I’ve seen others that are very similar and have posted voting records in other threads showing a much harder move to the right in Congressional Representative and Senators voting records but here is one from gallop showing how voters self identify as conservative, moderate or liberal.
political shift of democrats and republicans - Search
Republicans have risen from 58% conservative in 1994 up to 77% now.
Democrats have risen from 25% liberal in 1994 up to 55% now.
Independents have pretty much bounced around 45% M / 30% C / 20% L the whole time.
I guess you could say Democrats have technically moved further but Republicans are still more extreme and we’d both be correct.
1 Like
I’m pretty sure that’s DW-Nominate, which is a straight statistical regression, defined by voting records. Basically you make a map of congresspeople based purely on how much they vote with or against each other. There are criticisms of its validity, but it’s also one of the only ways to measure partisanship in an objective fashion.
Made somewhat famous by this xkcd view of US history.
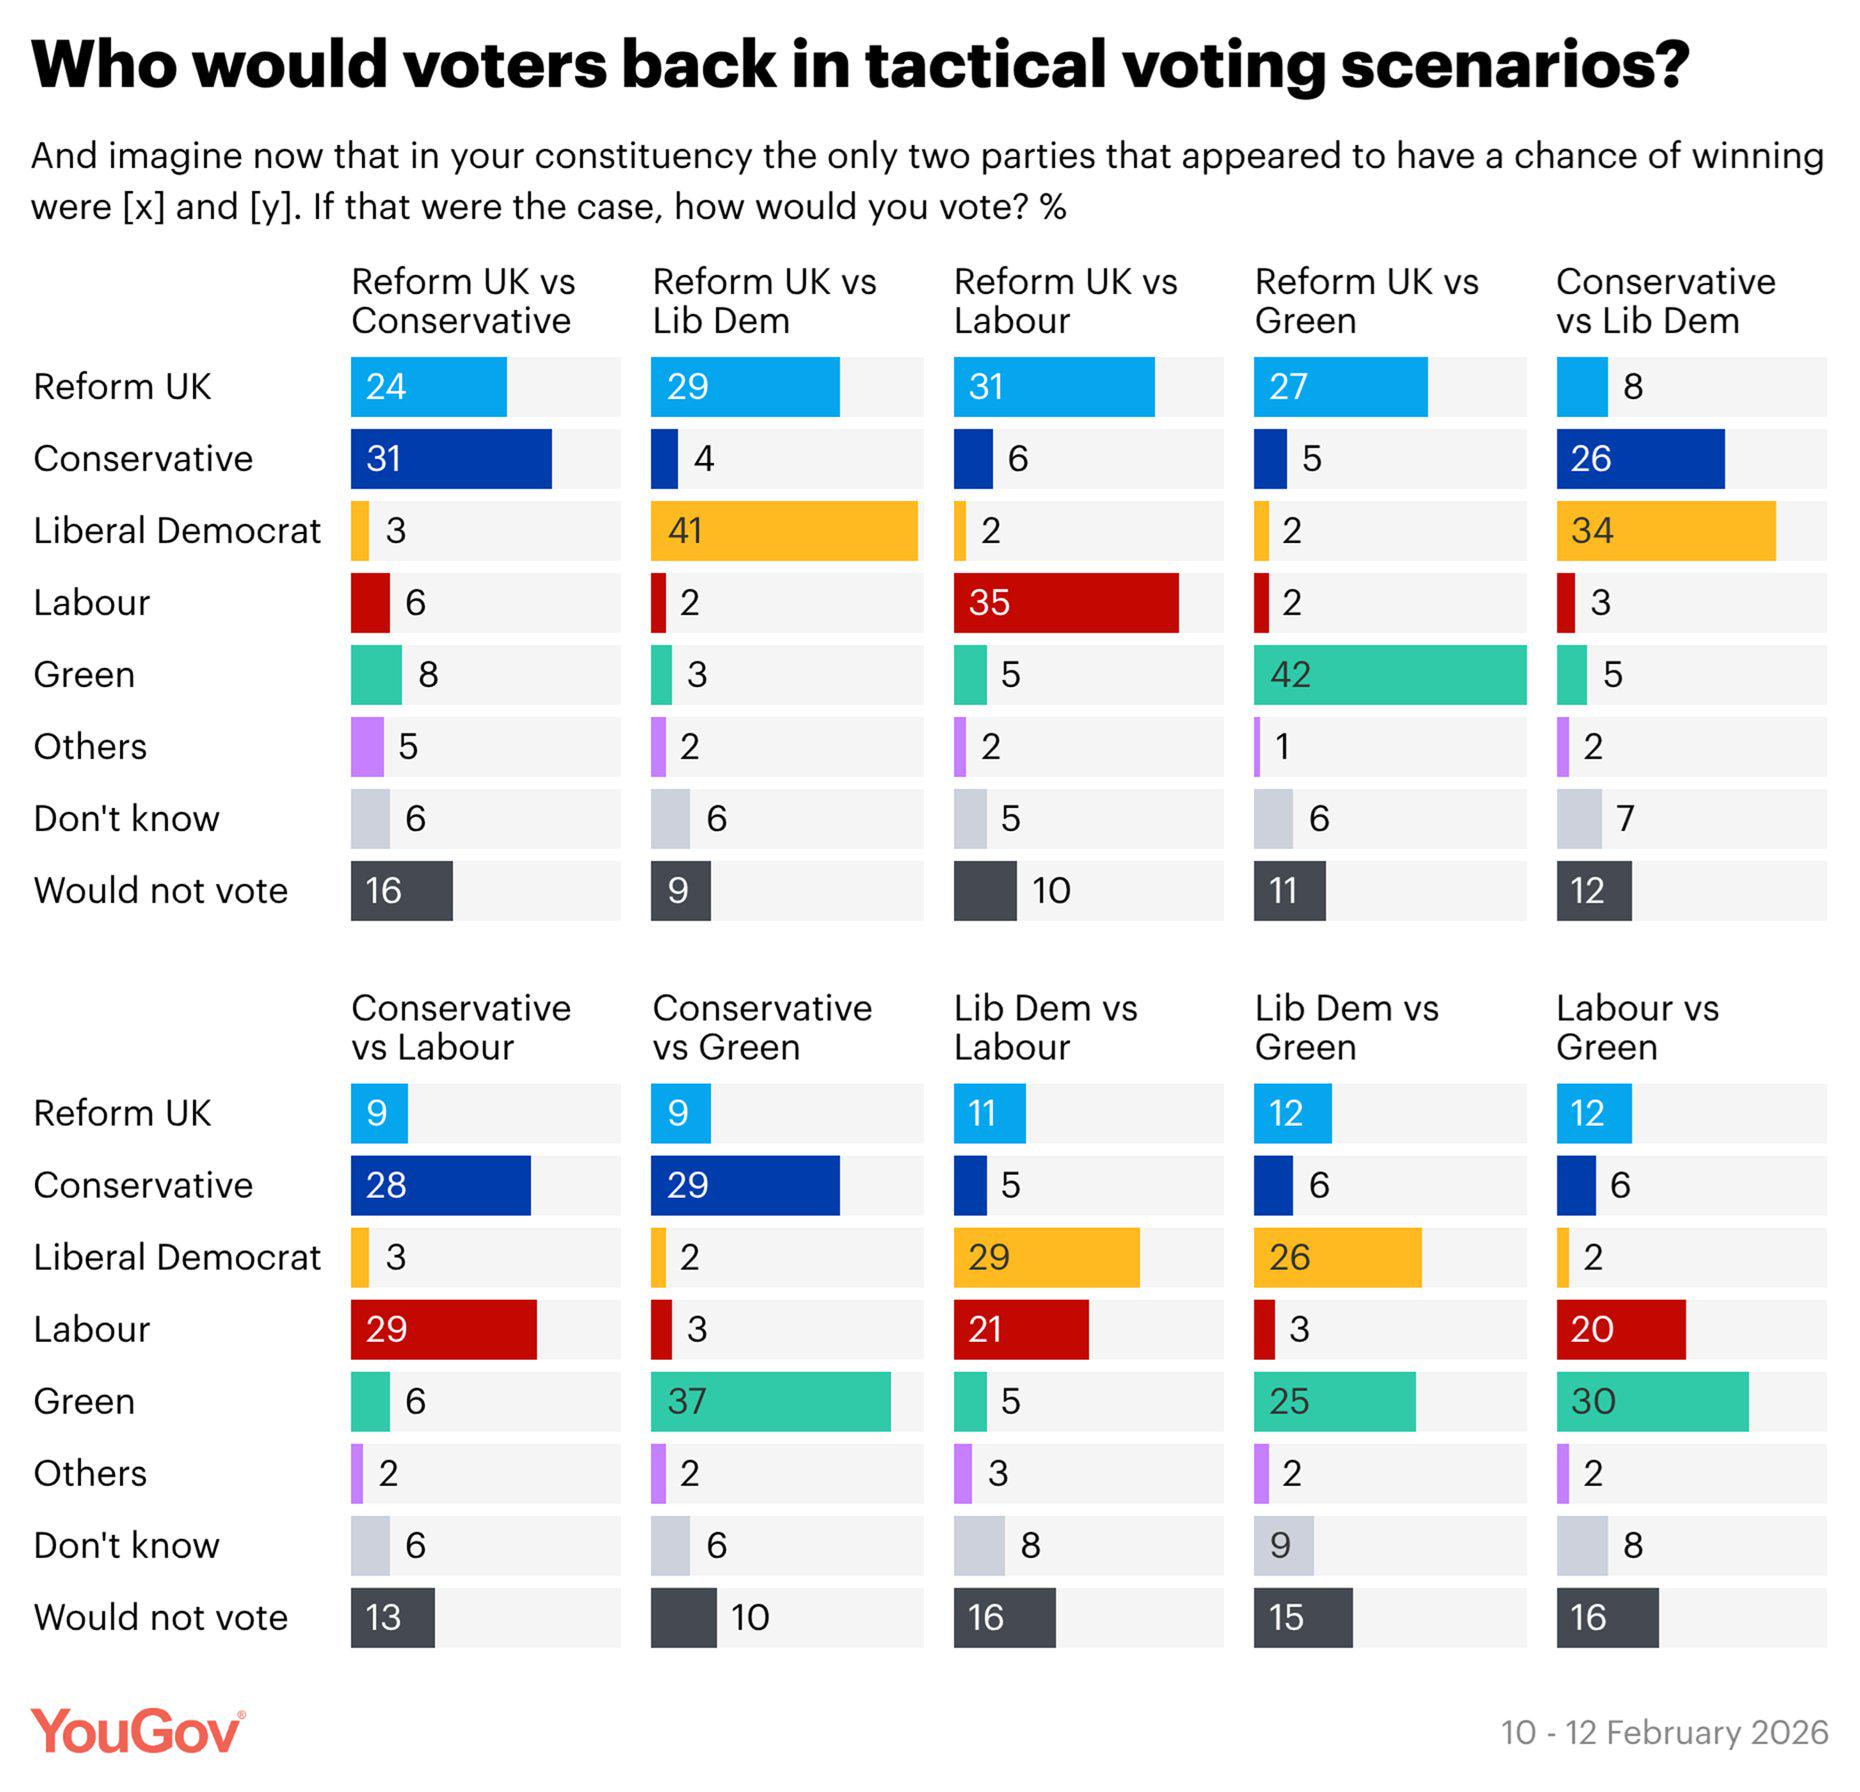
So it looks like Lib Dem/Labor/Green are more likely to back the other’s candidate than Reform UK/Conservative are to back each other.
I say this as someone who doesn’t know much about British Political Parties. Just some quick inferences from the graphic.
If only there was a voting system where voters could rank the candidates so that a candidate that 70% of the people would be unhappy with couldn’t win.
2 Likes
LibDem wins every contest.